
The US Dollar Index on Friday failed to extend gains to the current monthly highs of 100.56 after pulling back late on to close at around 100.36. The USDX has been on recovery since bottoming at around 98.70 earlier this month. It continues to trade within a consolidative upward trending wedge.
The DXY is currently pegged above the 100-hour and the 200-hour SMA lines in the 60-min chart. The dollar index also appears to have a lot of room to run upwards in the 14-hour RSI. The bulls will be optimistic going into next week.
The US Dollar Index Fundamentals Overview

From a fundamental perspective, the US Dollar index is trading at the back of a series of disappointing US economic data. On Friday, the US retail sales group posted a change of -15.3, which compared adversely to the expected change of -4.6%. General retail sales for April also missed the (MoM) expectation of -12% with -16.4%. On the other hand, retail sales ex-autos for the month also came short of -8.6% with a change of -17.2% (MoM). However, the Michigan Consumer Sentiment Index impressed with 73.7 versus an expectation of 68.
Earlier in the week, consumer price index ex-food and energy missed the (MoM) and (YoY) expectations of -0.2% and 1.7% with -0.4% and 1.4%, respectively. The general CPI and the Producer Price Index also disappointed on multiple levels. On Thursday, the initial jobless claims for the week ending May 8, missed the expectation of 2.5M claims with 2.981claims.
The US Dollar Index Technical Analysis (the 60-min Chart)
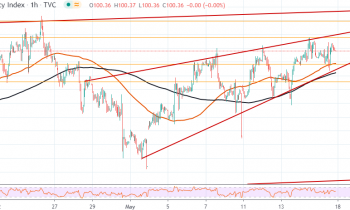
Technically, the USDX appears to be trading within a rising wedge in the 60-min chart. This indicates a short-term bullish bias in the market sentiment. The DXY still has room to run before hitting overbought levels of the 14-hour RSI.
The bulls will be targeting short-term profits at around 100.56 or higher at 100.80. On the other hand, the bears will be targeting short-term pullback profits at around 100.17 or lower at 99.91.
The US Dollar Index Technical Analysis (the Daily Chart)
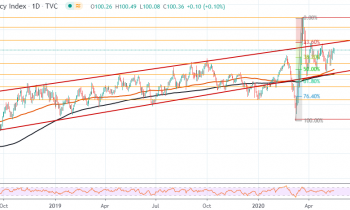
In the daily chart, the US Dollar Index appears to be trading in a consolidative pattern off a major swing in the price. It is now pegged within a gently ascending channel in the daily chart. This indicates a slight long-term bullish bias in the market sentiment.
The bulls will be looking to extend the current recovery towards 101.16 or higher at 102.21. On the other hand, the bears will target pullback profits at around 99.26 or lower at 98.39.