
The stock market turned lower after the rally ran out of steam
The comeback rally at the beginning of the market falters and currently the stock market trading back on the negative side. It seems the sell-off which happened at the beginning of the week will continue. Traders will brace for further downside in the stock market while waiting for a chance to buy at a lower level. We maintain the bullish situation for the long term but it is better to stay sidelined for now and wait until the bearish pressure subsides before entering long positions.
Technical Analysis
Dow Jones Industrial Average (INDU)
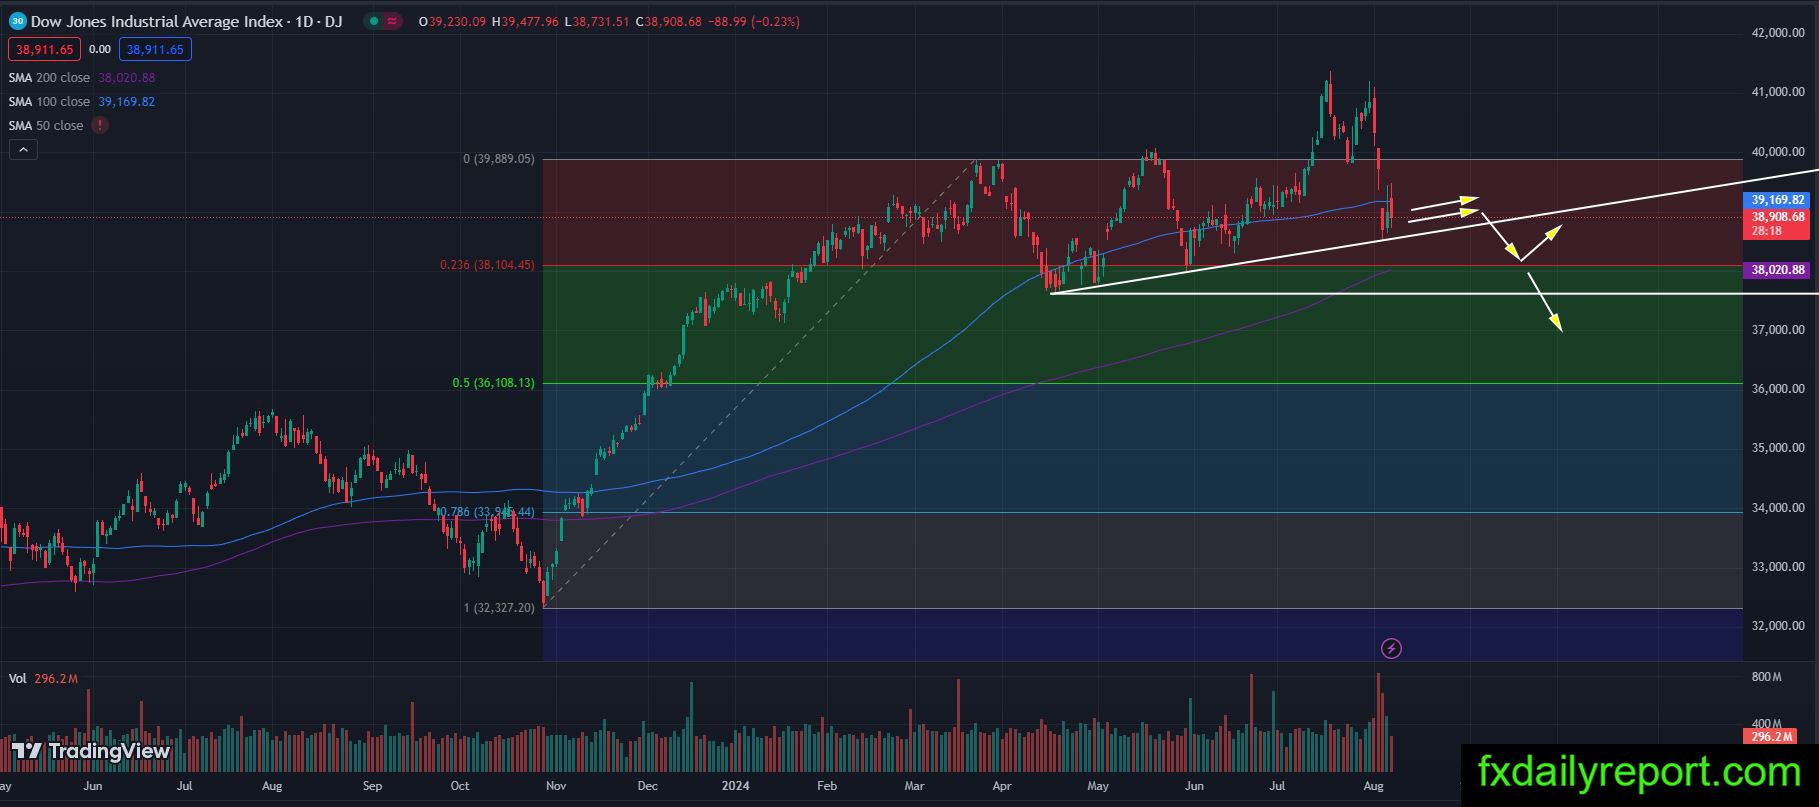

DJIA index continues under bearish pressure and currently trading near the trendline. If the bearish movement continues then it will target the 38,000 handles and also the daily SMA 200. A close below both levels will confirm the continuation of a bearish trend. If the index printed a new lower swing low then the medium-long term trend might switch to bearish.
Intuit Inc (INTU)

INTU share prices look trading inside a triangle formation. The overall trend is sideways inside the triangle but we might see further bearish pressure below the daily SMA 200. If the share prices continue lower and break below the trendline then the trend might turn bearish. Without any breakout, traders could use the triangle range for range trading.