
Stock futures looks flat in Tuesday’s trading
The movement of the stock market might continue ranging this week as traders continue monitoring the development of economic data releases. Recently, Japan reported stronger than expected GDP data of 6.0% vs. 3.1% expectations. This could mean a tightening will happen which could influence the global market decision. Generally, the August and September markets weaken which might provide traders with the chance to enter more long positions at a lower level.
Technical Analysis
Dow Jones Industrial Average (INDU)
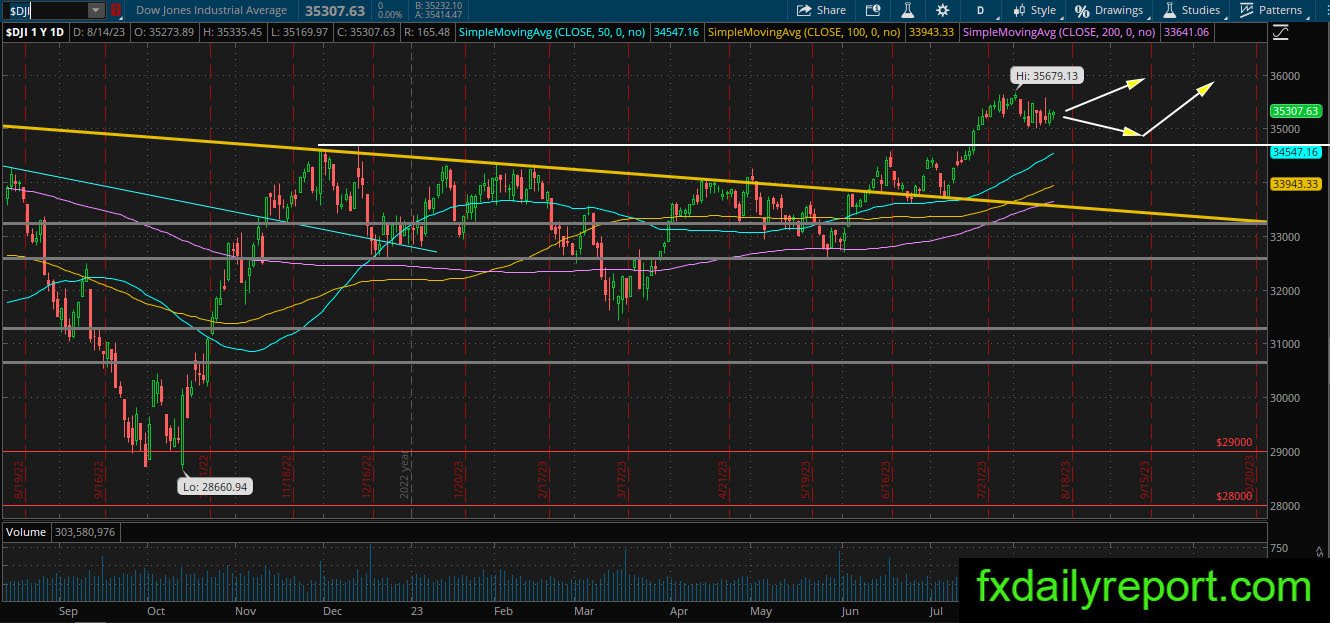

DJIA index continues moving sideways near the top and might extend the bullish movement to continue the bullish trend. Despite the situation, a bearish correction might be due and traders will wait near the support level for a chance to add more long positions. When a bearish correction happens, the 34,500 level and the daily SMA 200 will become the levels to watch for bullish reactions.
Rivian Automotive Inc (RIVN)
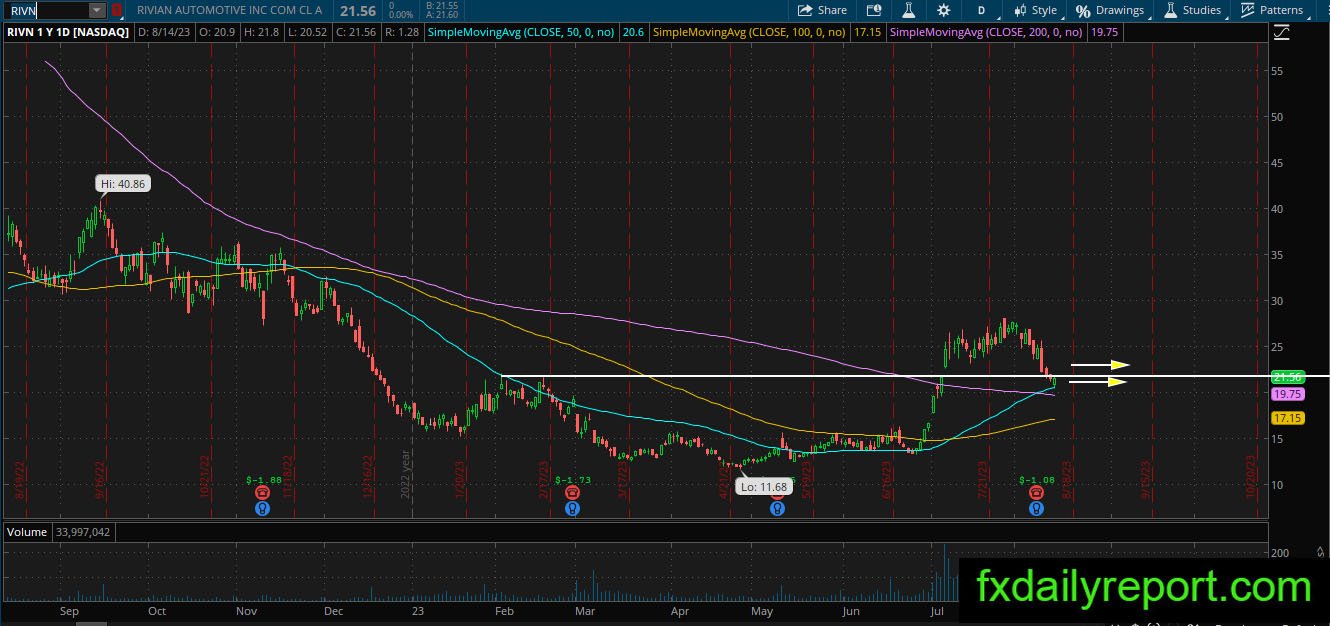
RIVN share prices have broken above the daily SMA 200 and turned the trend from bearish to bullish. The share prices also printed a new higher high on the daily chart. At the current time, the share prices turn lower and retesting the daily SMA 200. Traders could consider entering long positions near the averages when there are bullish reactions.