
Dow 22,000 done, what next?
On Wednesday, Dow Jones Industrial Average made another record high and claimed 22,000 landmarks. The index could continue higher following strong earnings report from U.S company. Currently, the market is open, and the index opened flat near previous day close.
BOE hold interest-rate, hint for rate hike in 2018
BOE is the headline today where market waits for further clarification on interest-rate. However, the central bank cut growth outlook for 2017 from 1.9% to 1.7% and cut another 0.1% for 2018. The bank maintains 2019 growth rate at 1.8%.

The bank voiced Brexit uncertainties put it under dilemma, but said higher inflation above 2% while growth slowing means rate-hike is not off the table.
Earnings & Corporate report
Take-Two (NASDAQ: TTWO) stock price target raised to $104 from $87 at KeyBanc Capital.
Mattel (NASDAQ: MAT) downgraded to underperform from neutral at D.A. Davidson. Price target cut to $18 from $22
Other market
Asian stock market dragged lower before BOE super Thursday. Nikkei down 50.78 points (-0.25%) to 20,029.26, China Shang Hai Composite down 11.65 points (-0.35%) to 3,273.41, and Australian ASX 200 down 9.08 points (-0.16%) to 5,735.12.
Crude oil flirting with $50 handle, currently traded at $49.72. Gold recovered all of its losses from an initial drop from $1,266 to $1,256, currently traded at $1,267.
Technical Analysis
Dow Jones Industrial Averages (INDU)
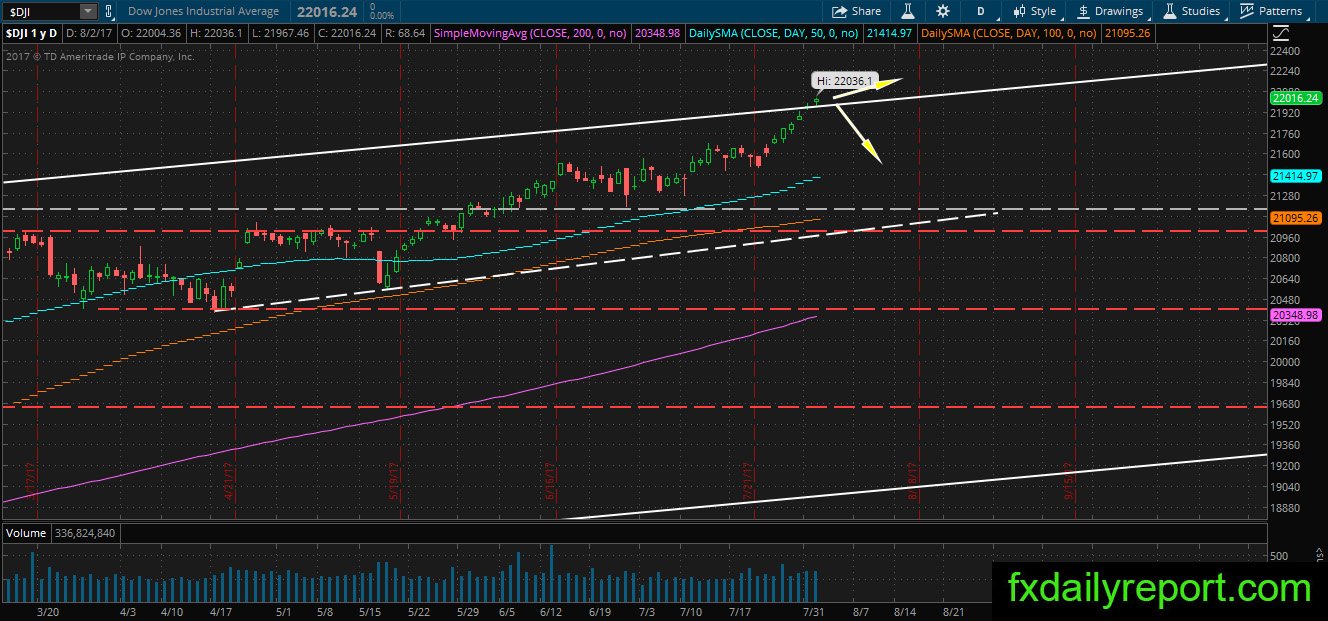
The target has been reached in DJIA, now where will the index head to? Same question as the previous day, traders are waiting for job data tomorrow after BOE conference clear stance of the central bank. There is the rumor the Fed will take a dovish stance which is good for the stock market, but who will buy at current level except for retail traders?
Du Pont (DD)
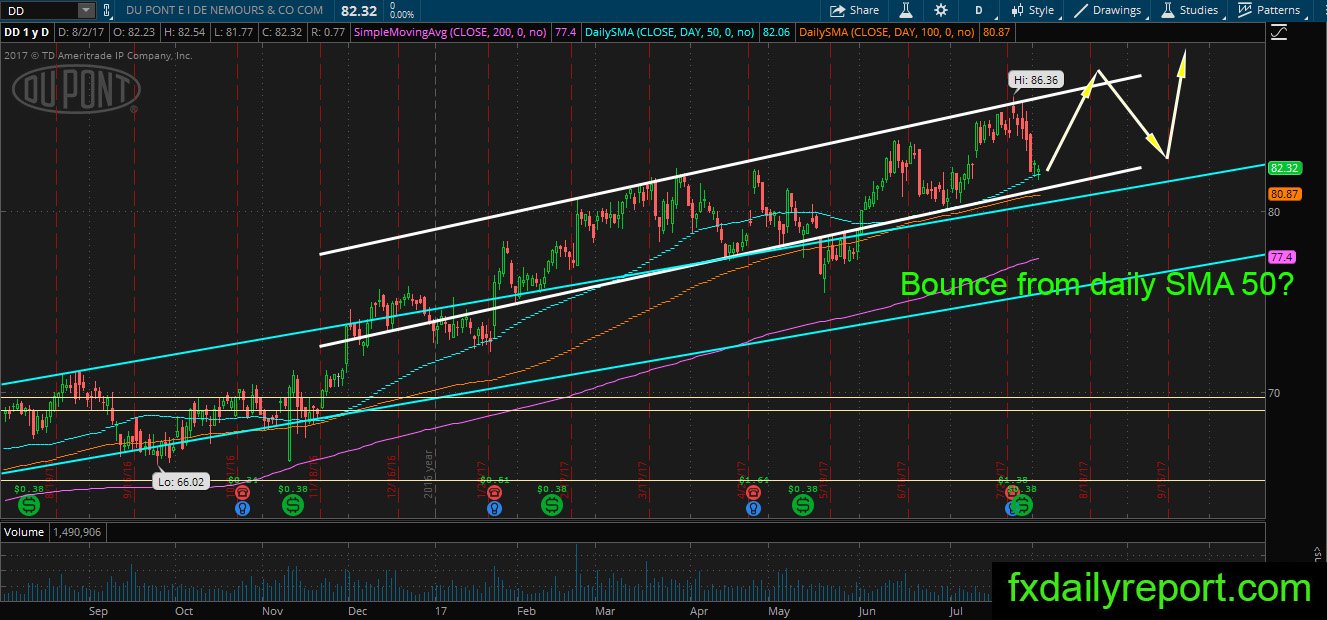
DD retreat from the top $86.36 straight to the daily SMA 50. There was two bullish candlestick formed near the averages, but the price continues made a lower low. Will it bounce from the averages or the white channel?
Other watch lists
GOOG – bullish pin bar pattern on the daily chart, might continue higher.
VZ – Bearish candlestick from the daily SMA 200. Possible sell-off if the second day closed as bearish candlestick below the pattern.