
Job data on the line, change of map?
U.S economy will be put to the test again as monthly job data due to out today. The job data will tell how the economy performs and become input for The Fed to decide economy policies. Non-farm employment data expected to record 182k job in the previous month. After this job data, The Fed next FOMC meeting scheduled on Wednesday, August 16.
Earnings & Corporate report
Cigna Corp (NYSE: CI) topped expectation. The company reported revenue of $10.32 billion vs. $10.26 expectation. Earnings per share come out at $2.91 vs. $2.48 consensus.
Other market

Asian stock market continues lower today following the intensifying Russia probe. Nikkei down 76.93 points (-0.38%) to 19,952.33, China Shang Hai Composite down 11.61 points (-0.35%) to 3,261.32, and Australian ASX 200 down 14.54 points (-0.25%) to 5,720.58.
European stock market slightly up before U.S job data, crude oil stable below $49.00 and gold hovering at opening level $1,268.
Technical Analysis
Opinion: U.S dollar the final trigger?

There is interesting reading from Mark Hulbert on U.S dollar index and the stock market correlation here. We try to picture out a monthly chart of U.S dollar and the recent rally in the stock market. It looks like U.S dollar index closed below the major level in the past where the index never closed below it. Although it is at a critical level, there is more room toward 91.92 (May’16 low). Now, let’s take a look at the DJIA monthly chart where it is near the top of the channel.
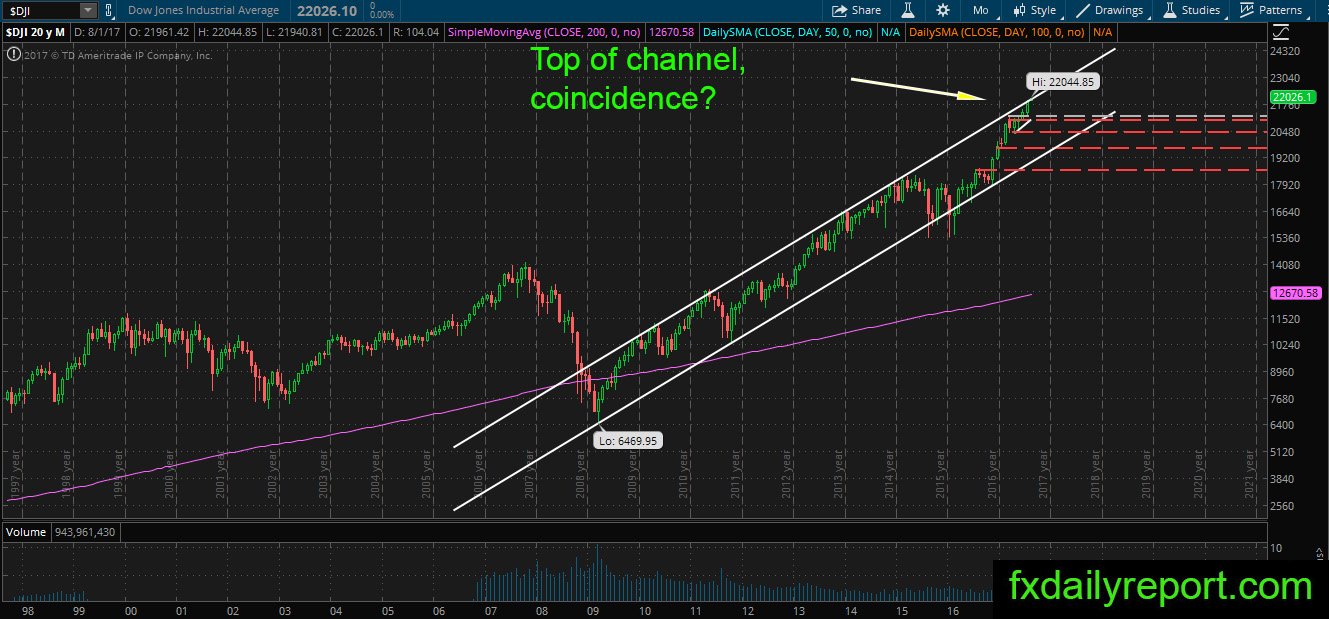
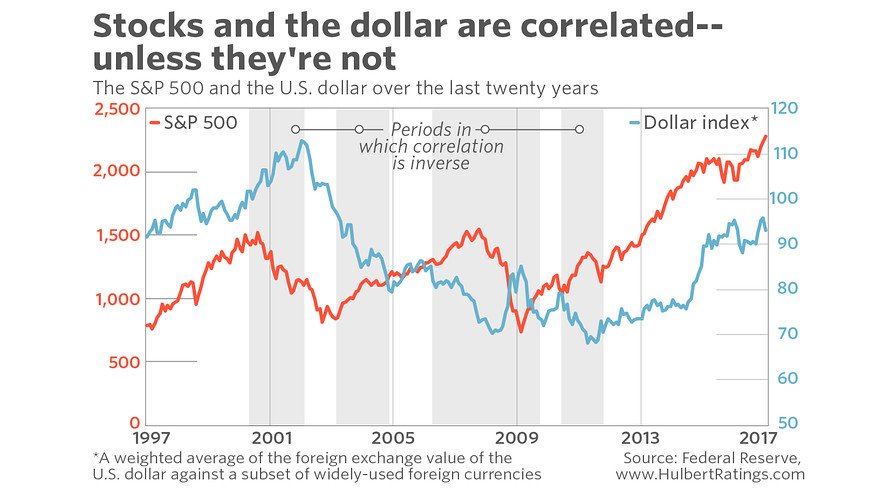
Tracing back five months ago, Mark Hulbert right, both index has an inverse correlation. However, the most interesting correlation could be summarized from stocks and dollar correlation chart.
- The first period 2001 – The stock market topped, and U.S dollar index started the rally.
- Somewhere in 2002, U.S dollar index starts its decline and accelerate as stock market reversed.
- Between 2009 – 2012 stock market find bottom and rally but U.S dollar lagged until the end of 2012 it starts rally.
- Since then both indexes are moving in-line until this year where both inversely correlated.
Looking at the chart, it seems U.S dollar always lagged several years behind the stock market. At current situation as both index inversely correlated, what will happen if U.S dollar index print first bullish candlestick on the monthly chart? It will be interesting to look at both index position by the end of the month.
Valley National Bancorp (VLY)
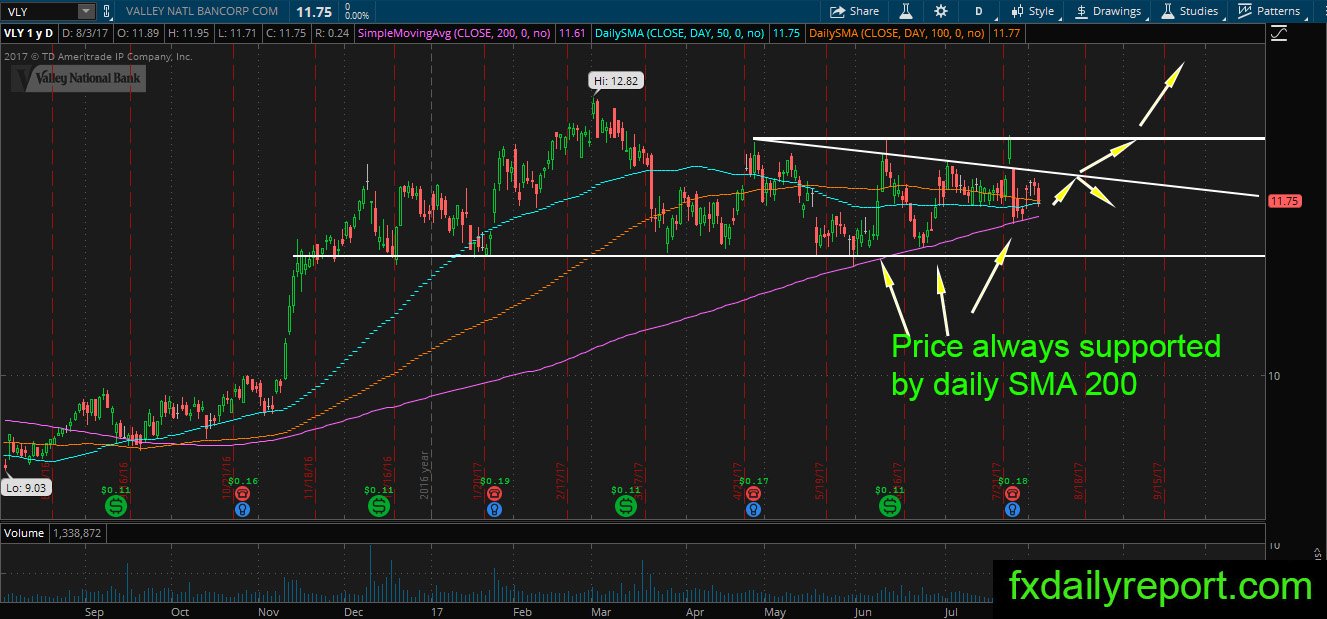
VLY stock price squeezed between the daily SMA 200 and the downtrend line. In the previous test of averages, the stock price manages to bounce three times. Will it hold position above the averages and start to climb toward $12.4 horizontal resistance?
Other watch lists
TWLO – Look for bounce higher from the daily SMA 100. If the bounce could move above SMA 200, it might be able to close the gap produced in May.
TKR – Approaching the daily SMA 200, look for bounce higher.
CL – Back to the daily SMA 200 after earnings jump, might break lower.