
Bubble, is it true?
It has been fantastic year and month following Dow Jones Industrial Averages and other indices new record high. However, the higher it is, the more famous names started to shout we are ready for the steep drop. The stock market is in a bubble, ready to sell!
That is some of the headlines we could see as the stock market thread higher. Fortunately, they are right at some time the stock market will reverse, and if they are lucky, they could guess the top and become more famous. Unfortunately, no one manages to call the right top 10 times in the row which means “Never guess the top.”

While we could not predict accurately where the top, it is also suggested to avoid buying at the top. Moreover, the best advice to take is “Only buy when there is a correction in prices.”
Stock market prepares for more upside
Dow Jones Industrial Averages futures pointed up 50 points in Asian trading session which suggests a bullish day under play. The outlook supported as Asian stock market gain. Currently 2.11 AM EST, Nikkei up 123.23 points (+0.62%) to 20,075.56, China Shang Hai Composite up 6.2 points (+0.19%) to 3,268.28, and Australian ASX 200 up 53.72 points (+0.94%) to 5,774.30.
European stock market also set to follow Asian lead to the upside.
TSN, FDC, ON, BAH, DCP, GEO, KOS, IIVI, HAE, FOLD, HZNP, FI set to report earnings before U.S market open.
Technical Analysis
Dow Jones Industrial Averages (INDU)
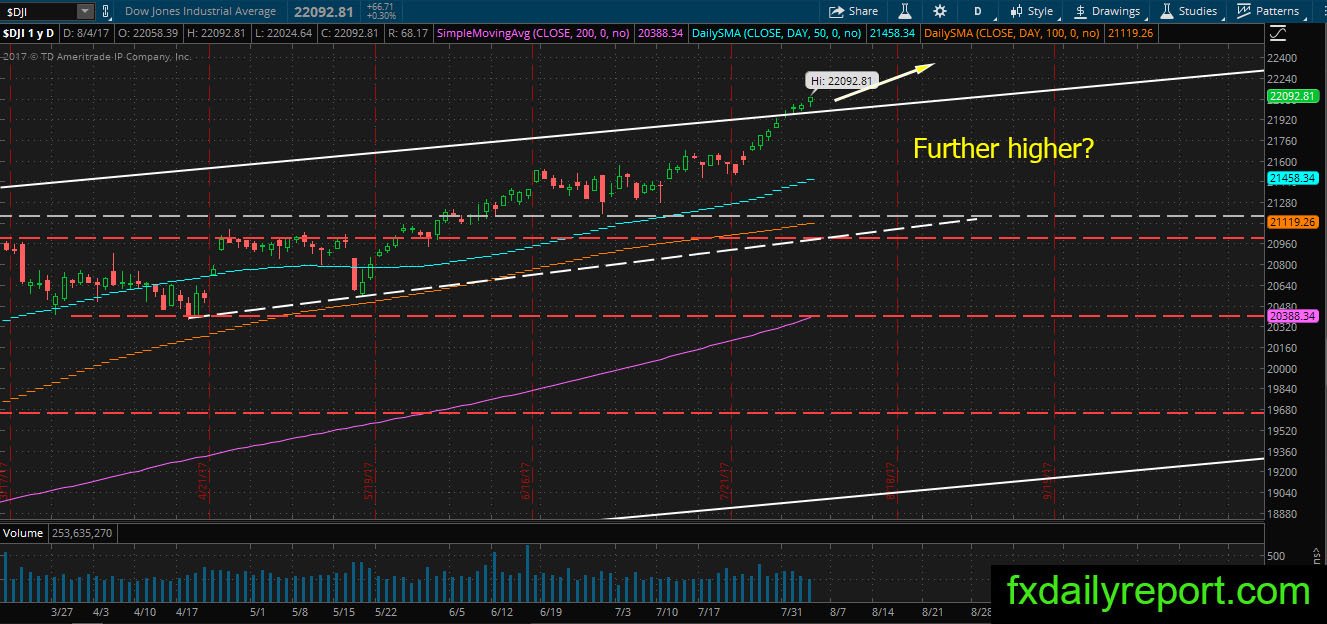
The index claimed 22,000 in the previous week and looked ready to continue further higher after better than expected job data. The fundamental from company result also supported for further upside. At current situation, traders may want to stay sideline for a while until the index run out of steam and fall to support.
South State Corp (SSB)
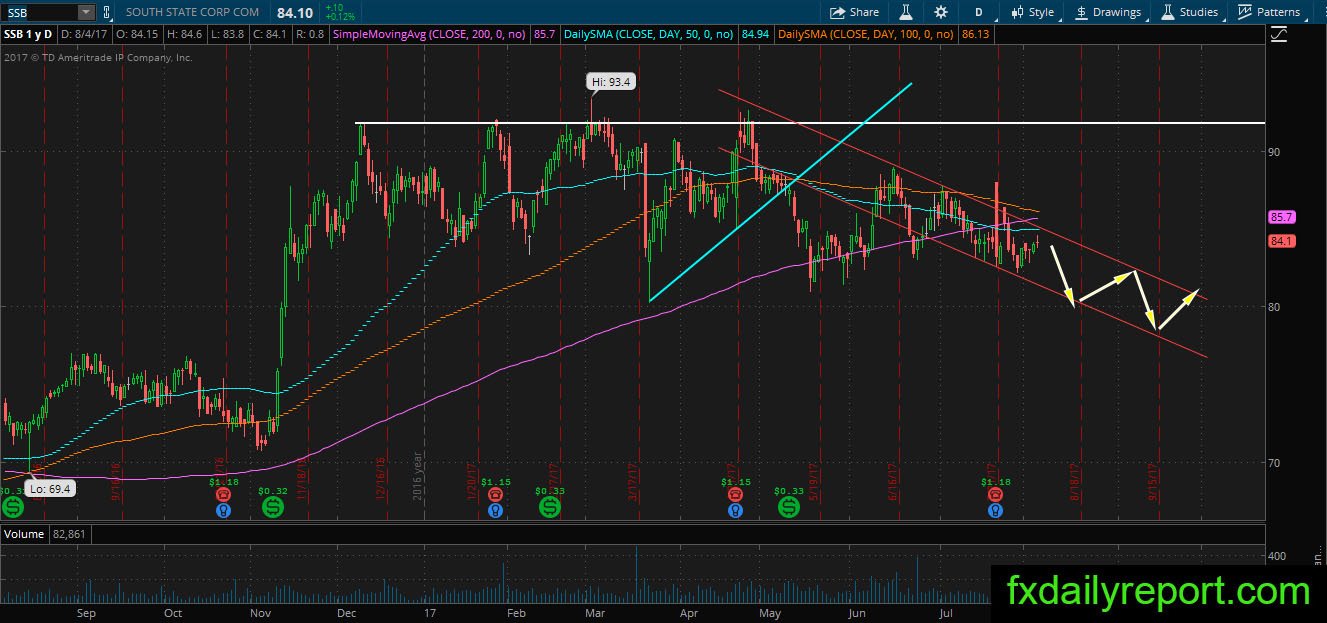
SSB share prices broke below the daily SMA 200 and entered bearish trend. Currently, the price edge up and approaching its daily averages also the top of the channel. There might be an opportunity to sell short the share when it reaches the resistance.
Franklin Resources Inc (BEN)
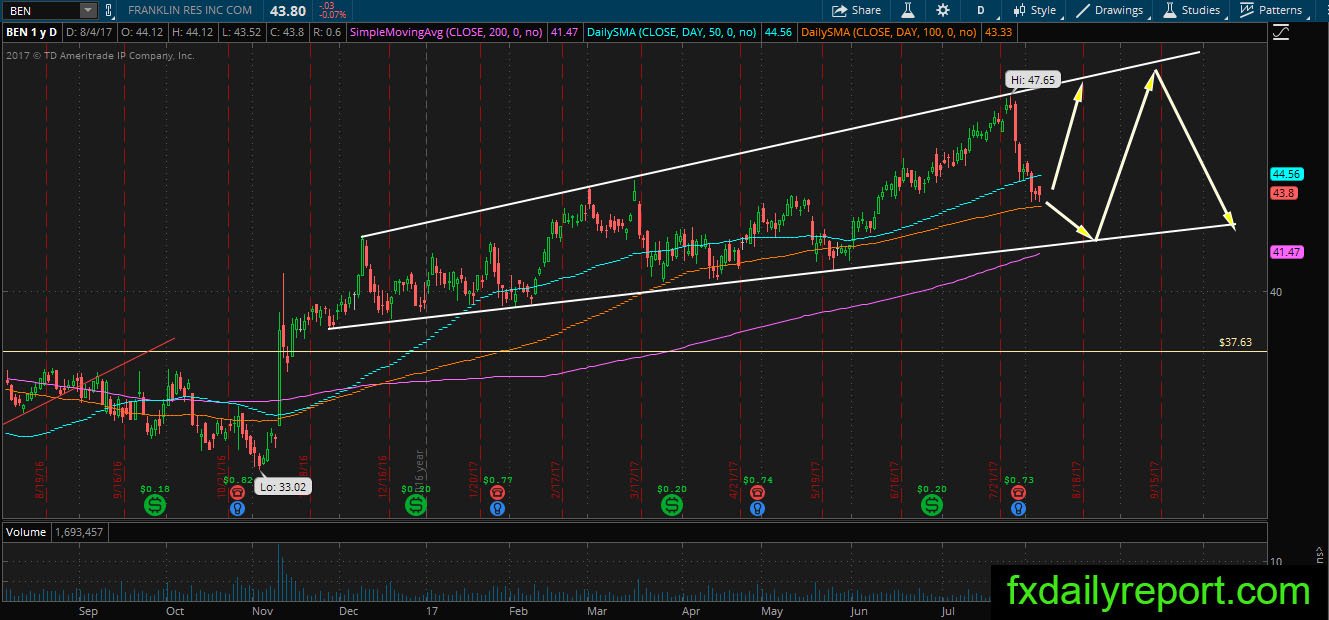
BEN undergo correction since the price hit $47.65 high. Currently, the price hovering at the daily SMA 100 and has not shown any sign of a bounce. If the price continues further downside, it might hit the lower trendline where there is daily SMA 200. Traders could look for a long position at either daily SMA 100 or SMA 200.
Other watch lists
CATY – The price squeezed between its averages, looking for a breakout at the end of consolidation.
RHP – Bounce from daily SMA 200, might continue upward.