
U.S stock market set to open the month with a bullish tone
DJIA futures up more than 300 points before the opening bell which indicates major bullish pressure today. Vaccine news continues to dominate the world. Recently, Pfizer and BioNtech applied for conditional marketing authorization of the coronavirus vaccine. This could mean the vaccine will be distributed before the end of the year.
On the economic ground, traders and investors will observe The Fed Jerome Powell speech and ISM manufacturing PMI data. The Fed Jerome Powell expected to deliver a dovish view on the U.S market while continue pledging to back the economy. ISM manufacturing PMI expected to release with 57.9 reading.
Asian & European Stock market

The Asian stock market mostly higher. Japan stock market up 353.92 points (+1.34%) to 26,787.54, China stock market up 60.18 points (+1.77%) to 3,451.94 and Australia ASX 200 up 70.70 points (+1.08%) to 6,588.50. The European stock market also moves to the upside. DAX Germany up 0.83%, UK FTSE up 1.85%, and Euro Stoxx600 up 0.71%.
Technical Analysis
Dow Jones Industrial Average (INDU)
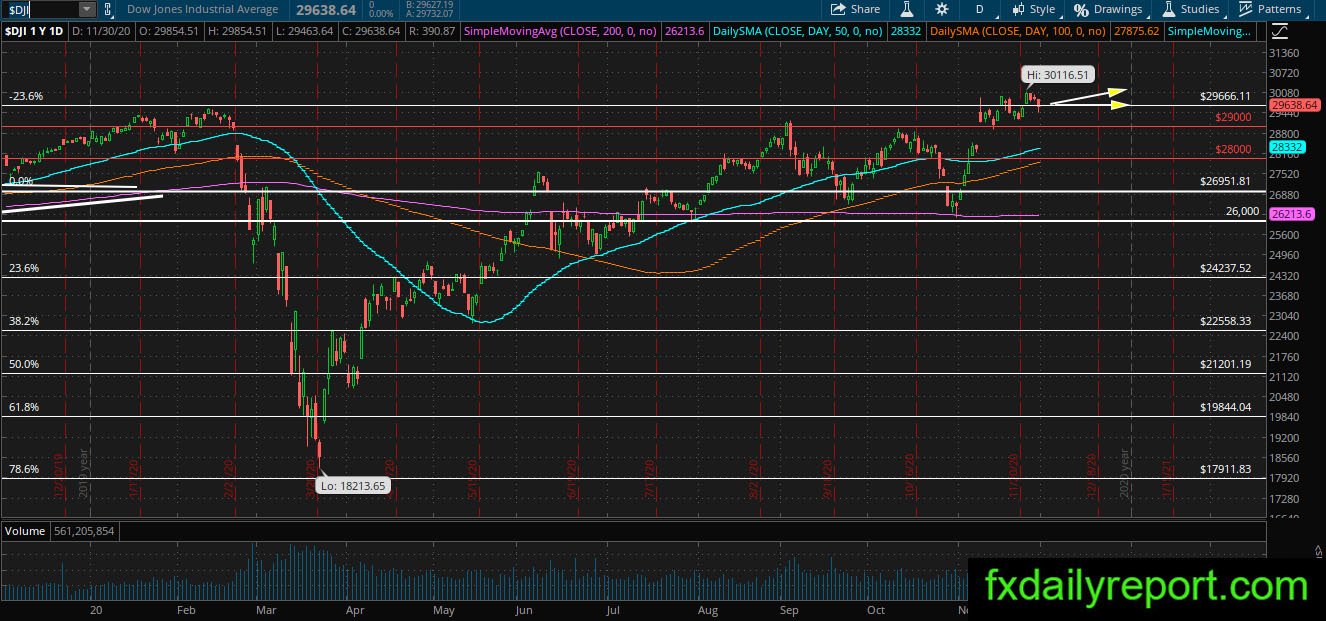
DJIA mostly sideways now near the 30,000 handles. The index futures are currently higher more than 300 points which indicates a strong opening. Traders who have long positions in equity could continue to hold the positions. Meanwhile, if a bearish correction happens then traders will observe the major averages level on the chart especially the SMA 200.
Coca Cola Co (KO)
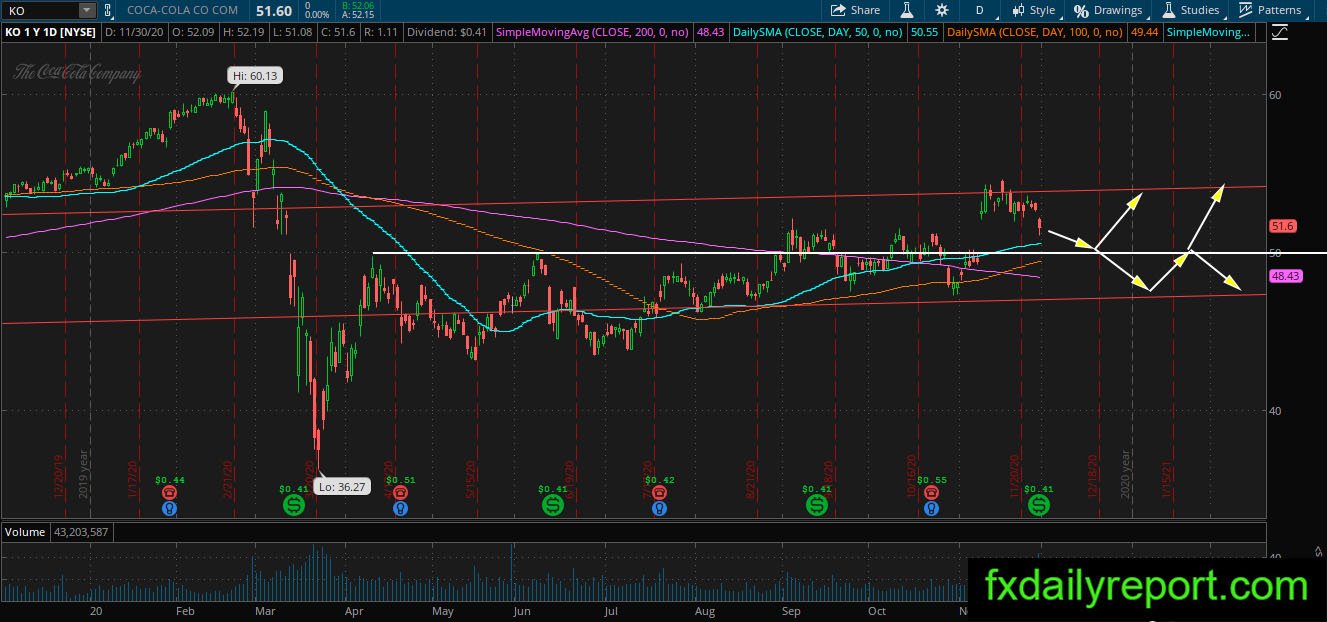
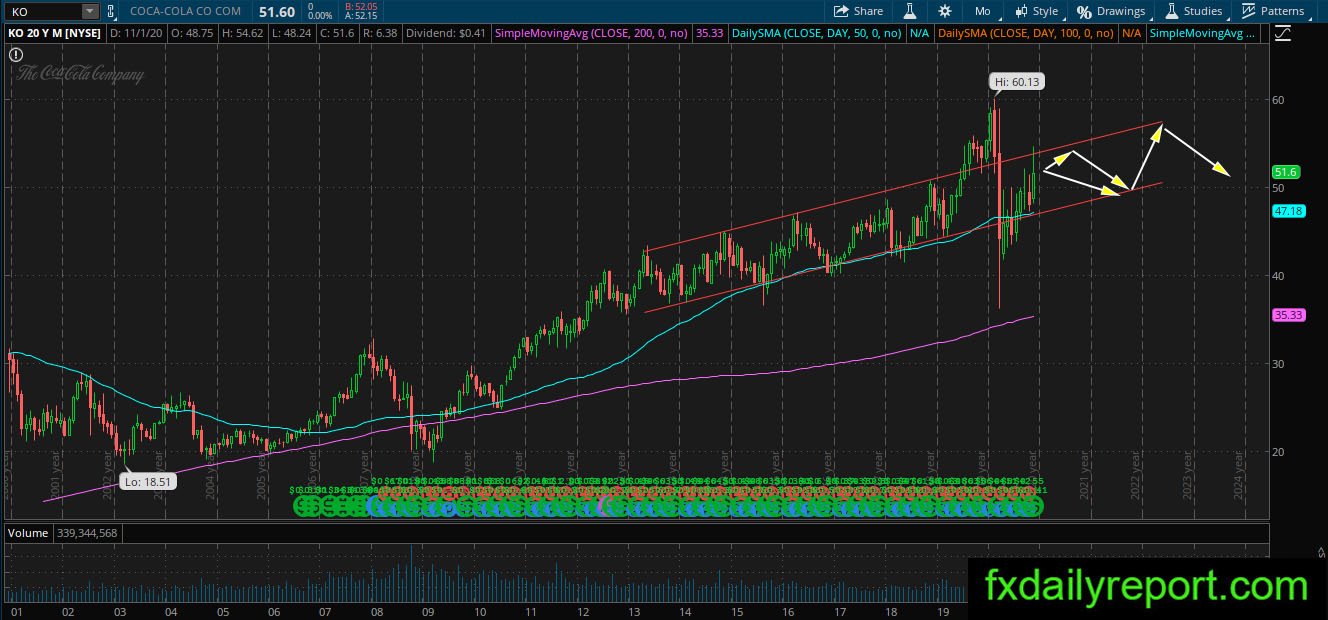
KO share prices trend continue pointing to the bullish side after the major bearish movement this year. We could see the bullish channel on the monthly chart maintained and currently KO is moving toward the top of the channel. On the daily chart, traders could see the share prices rejected from the top of the channel and soon will reach the $50.00 handle.
If the $50.00 could hold out against bearish pressure then long positions could be taken near it. On the lower side, the bottom of the channel and daily SMA 200 are the levels to watch.