
Dow above 24,000 on tax-reform optimism
Dow Jones Industrial Averages stage a rally of 331 points Yesterday on tax-reform optimism. The vote which expected to conclude on Thursday pushed back by Senate. Now, the next vote will be at 11 AM Friday. The vote will direct the market sentiment today. A “No” means the stock market might tumble and DJIA might slip below 24,000. However, A “Yes” will blow the market and lead DJIA toward 25,000 without much resistance.
Traders will observe the vote today while monitoring Manufacturing PMI data release at 10 AM. Expectation show reading of 58.4.
Asian & European Stock market

Asian stock market mostly up on Friday. Nikkei up 94.07 points (+0.41%) to 22,819.03, Shang Hai Composite up 0.62 points (+0.02%) to 3,317.81 and Australia ASX 200 up 19.86 points (+0.33%) to 5,989.76. European stock market on the other hand underwater. DAX Germany down 0.82%, FTSE UK down 0.16%, and Euro STOXX 600 down 0.55%.
Technical Analysis
Dow Jones Industrial Average (INDU)

DJIA is charging strongly above 24,000 round number and closed above it. The index direction is uncertain today as tax-reform vote loom. The market will watch Senate vote at 11 AM, depending on the result, the index could either continue upward toward 25,000 or slip lower below 24,000. DJIA futures currently down 40 points before market open.
Coca-Cola (KO)

KO share prices fell sharply yesterday, but manage to recover all of its loses and closed bullish. The bullish movement might continue today following the tax-reform vote. Traders might want to wait for the result first before jumping in position.
Franklin Resource Inc (BEN)
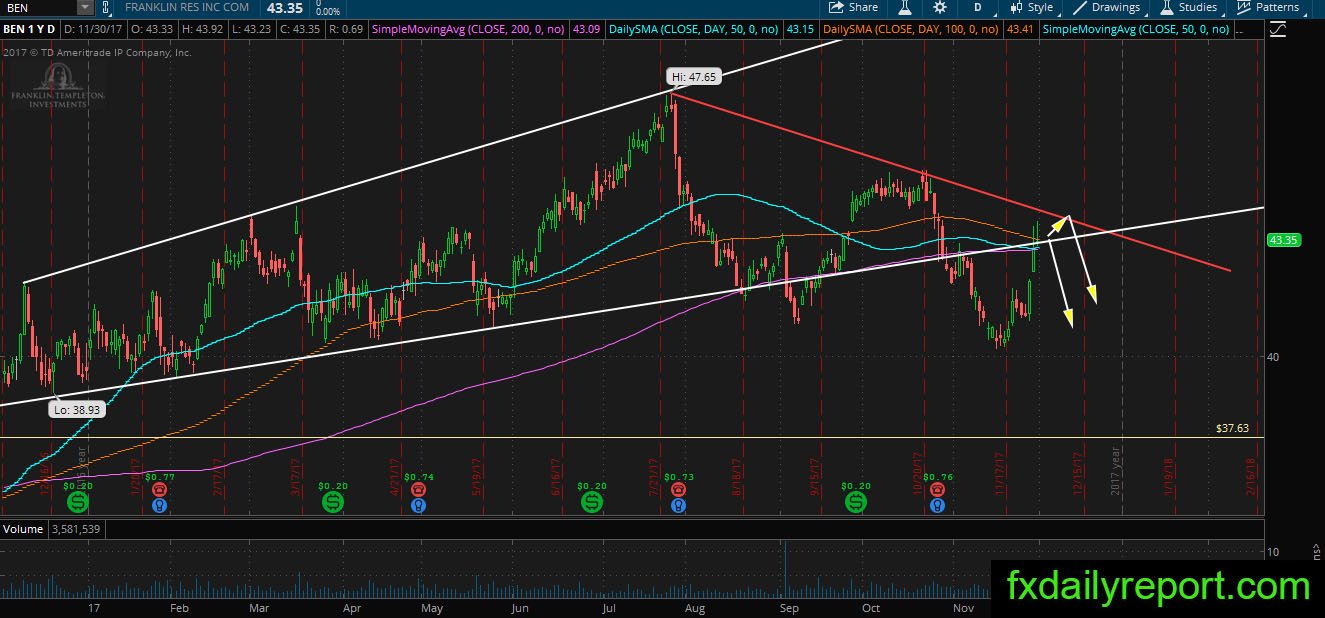
BEN share prices are at interesting places as it challenges daily SMA 200. There is red downtrend line above the averages which tell traders the resistance stack more than support. If the share prices rejected from averages or the trendline, it would continue down to test $40.00 handle.
Other Watchlist
TWTR – The range between daily SMA 50 and $20 is worth to watch for a bullish bounce.
JWN – The share prices closed above daily SMA 200, watch for re-test and bullish continuation.
AMT – Look for bounce from daily SMA 5- & 100