
Talk under progress while the U.S under risk of national emergency
The bullish build up since the beginning of the week is under risk as President Trump announce the plan to declare a national emergency to fund the border between U.S and Mexico. Aside from the news, previous day coreretail sales recorded a steep decline of 1.8% which translate into an economic slowdown.
Asian stock market also suffered the setback today after China inflation came out at 1.7% vs. 1.9% expectation yoy. If today high-level trade talk between U.S and China provide a no deal then it will blow fear across the market. Recent data has shown the impact of trade wars between U.S-China, a continuation of the trade war only will hurt both side and global market.

Deere Co (NYSE: DE), PG&E Corp (NYSE: PCG) and Pepsi Co (NASDAQ: PEP) will report earnings before the market open.
Asian & European Stock market
Asian stock market mostly lower. Japan stock market down 239.08 points (-1.13%) to 20,900.63, China Shanghai Composite down 37.31 points (-1.37%) to 2,682.39, and Australia ASX 200 up 6.70 points (+0.11%) to 6,066.10. European stock market, defying gravity and moving up. DAX Germany up 0.41%, UK FTSE up 0.39%, Euro STOXX600 up 0.65%.
Technical Analysis
Dow Jones Industrial Average (INDU)
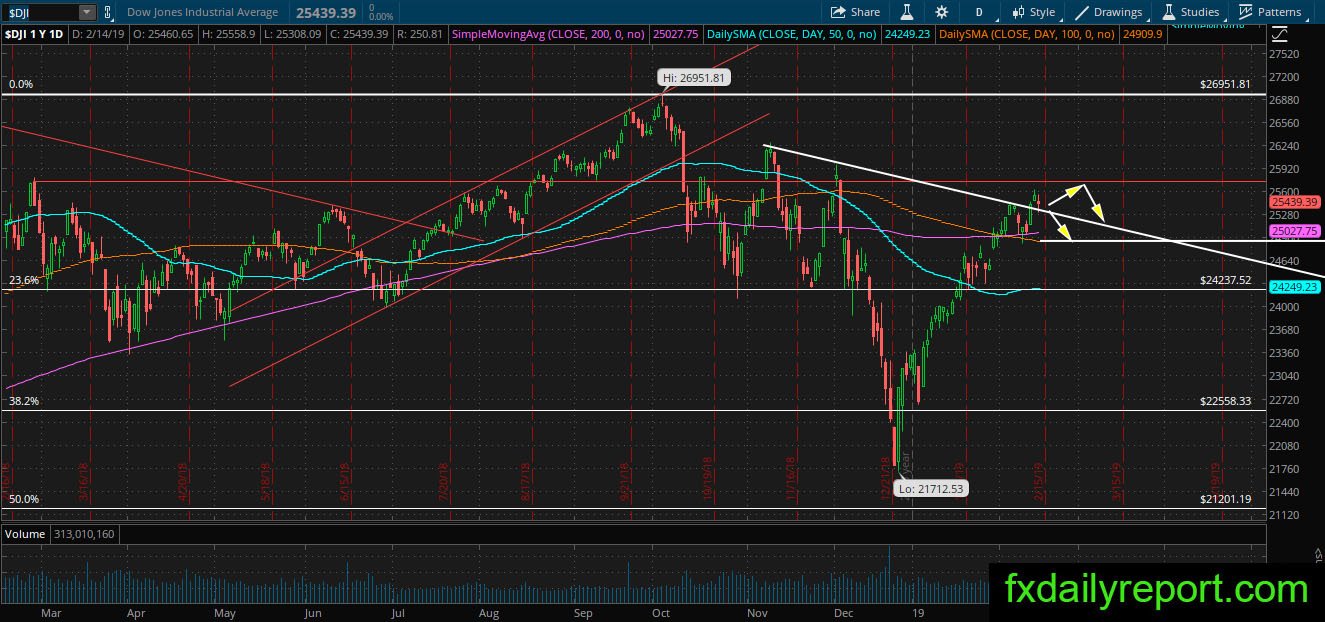
DJIA under pressure as political tension shooting up after President Trump announce a plan to declare a national emergency. The purpose of this policy is to get funding for U.S-Mexico border wall. DJIA expected to continue under prareessure at the end of week and may fall toward the daily SMA 200.
Eaton Corp (ETN)
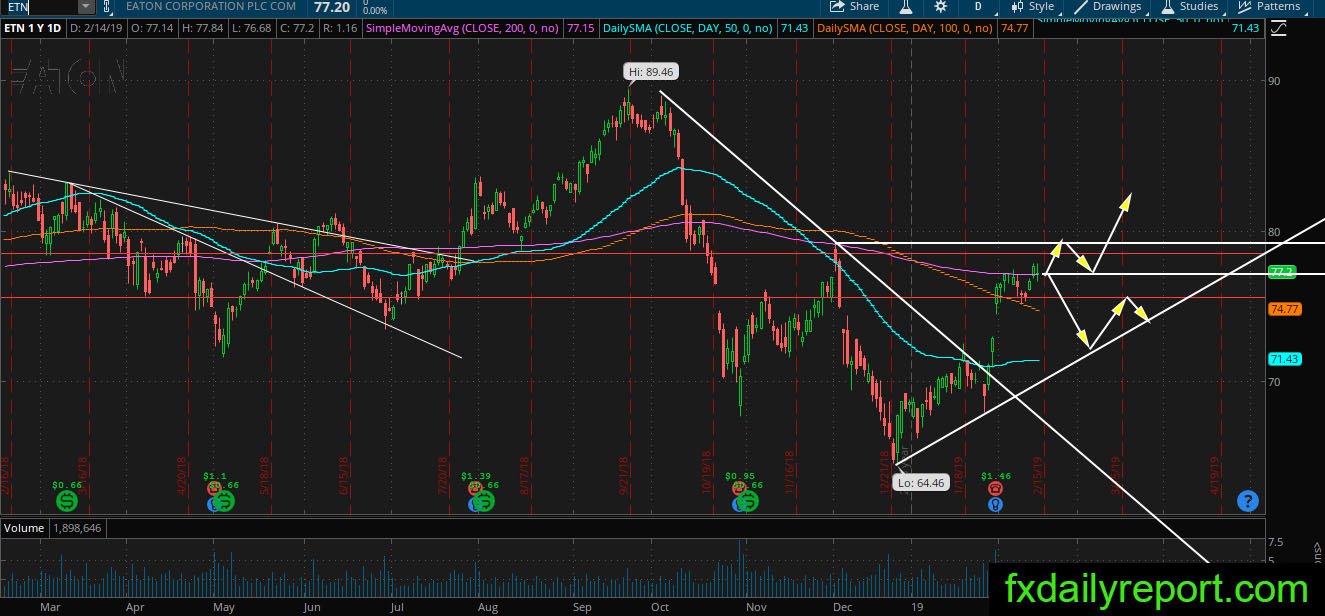
ETN might be at the cross road as the share prices hanging at the daily SMA 200. The overall trend is bearish for medium-term, but on the short-term there is strong bullish pressure. If the share prices could surpass SMA 200 and resistance around $79.00 then it will start a new bullish leg. On the other hand, rejection from the averages will trigger selling and new bearish leg.
Kimberley Clark Corp (KMB)
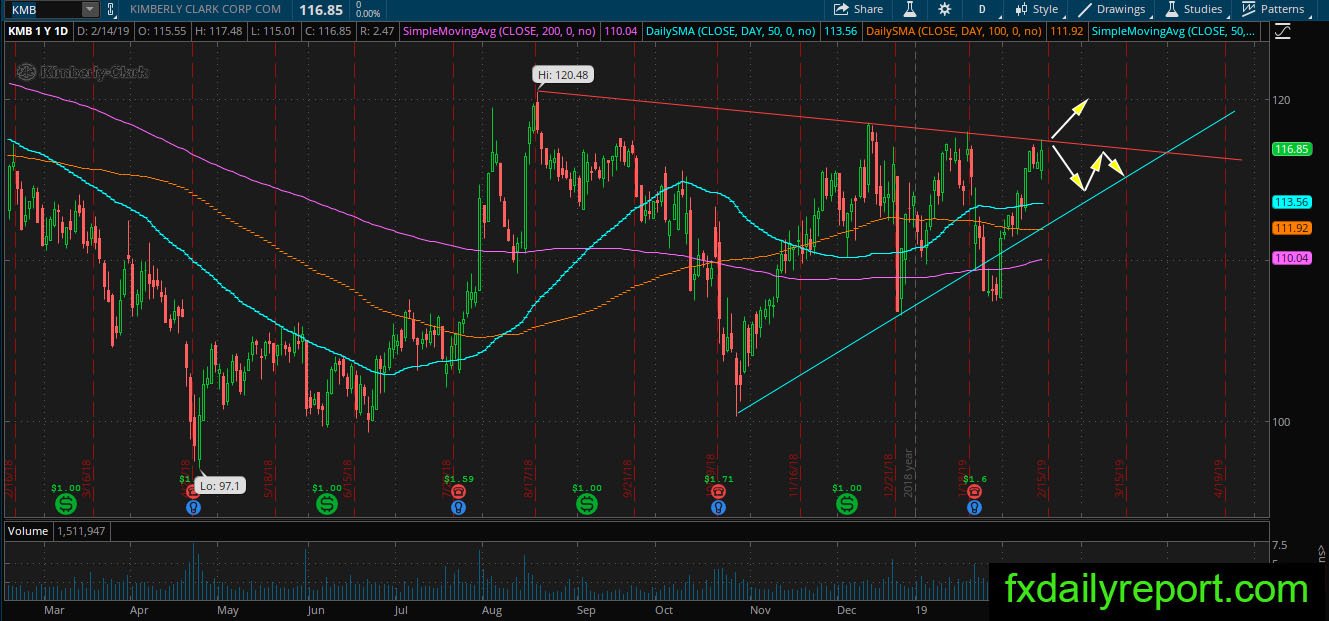
KMB projection is inside the two trendlines shown on the chart. The trendline has proven its effectivity at least three times. Currently, the share prices is testing the top trendline. If there is no change to the situation then we could expect KMB to start moving down from the current level.