
Futures advance on renewed optimism
In the previous trading session, U.S stock market posted sharp gain as fear of higher interest-rate subside. Previously, the yield on the 10-year Treasury note creeps higher, dwelling near 3% mark before settling at 2.9. Currently, the yield keeps moving lower at 2.843%.
The market seems to get optimistic after the cautious report by The Fed. Although minutes of FOMC meeting given a strong impression on rate-hike. On Sunday, The Fed gave no sign to raise interest rate three or four times this year on the report to Congress.

This week, the market will continue to observe The Fed speeches to get a clear idea on future interest-rate.
Asian & European Stock market
Asian stock market shine as U.S dollar decline. Nikkei up 260.85 points (+1.19%) to 22,153.63, Shang Hai Composite up 41.23 points (+1.25%) to 3,330.25 and Australia ASX 200 up 42.40 points (+0.71%) to 6,042.20. European stock market also rallies before ECB speech. DAX Germany up 0.42%, FTSE UK up 0.61%, and Euro STOXX 600 up 0.61%.
Technical Analysis
Dow Jones Industrial Average (INDU)
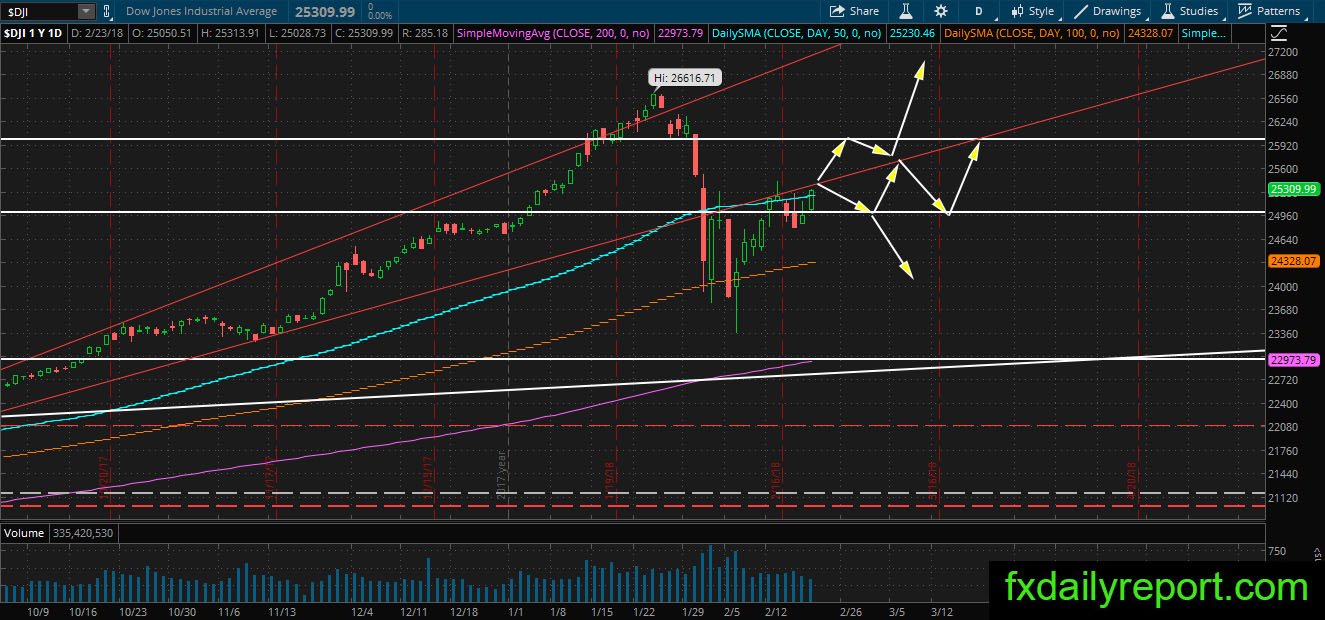
The index is in another upward sentiment as it closes above SMA 50 in the previous week. Today, the index futures pointed up triple-digit before market open and suggest DJIA will challenge the red trendline. If the trendline is broken, 26,000 is the next destination.
Guess? Inc (GES)
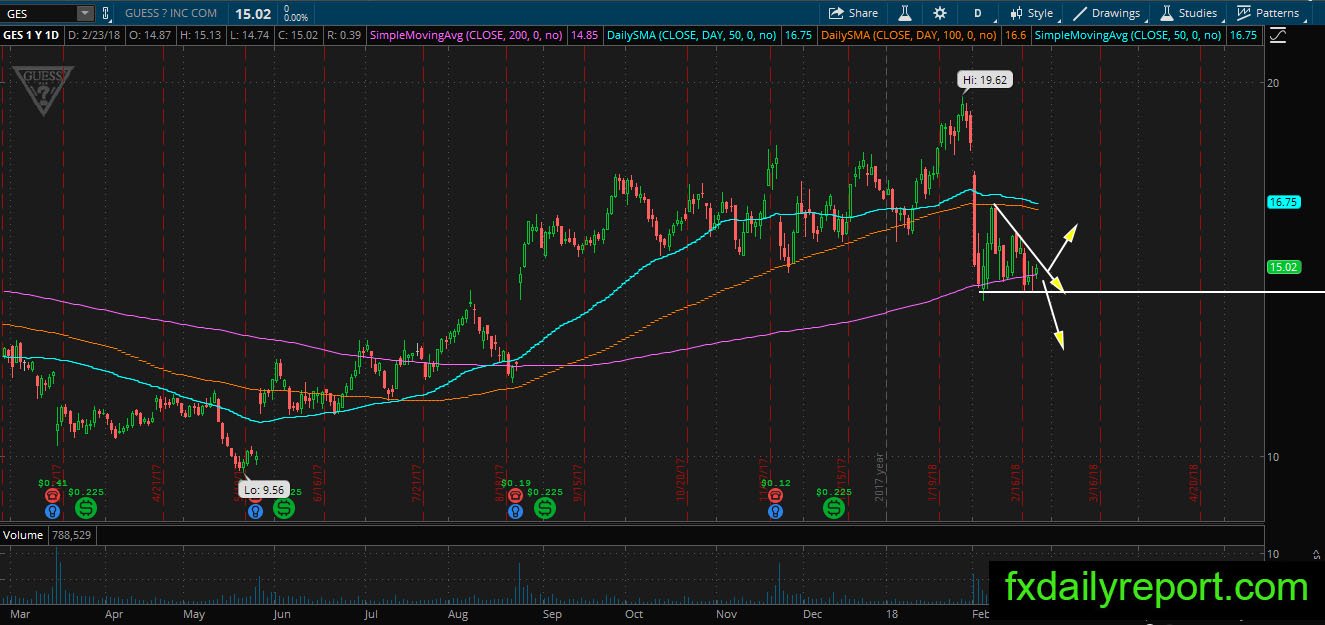
The movement of GES share prices halted its drop at the daily SMA 200. However, the situation is not favorable for the bull as the high gets lower. Most of the time, the price will breakout lower. Traders could prepare for the breakout either above the trendline or below daily SMA 200.
Qualcomm Inc (QCOM)
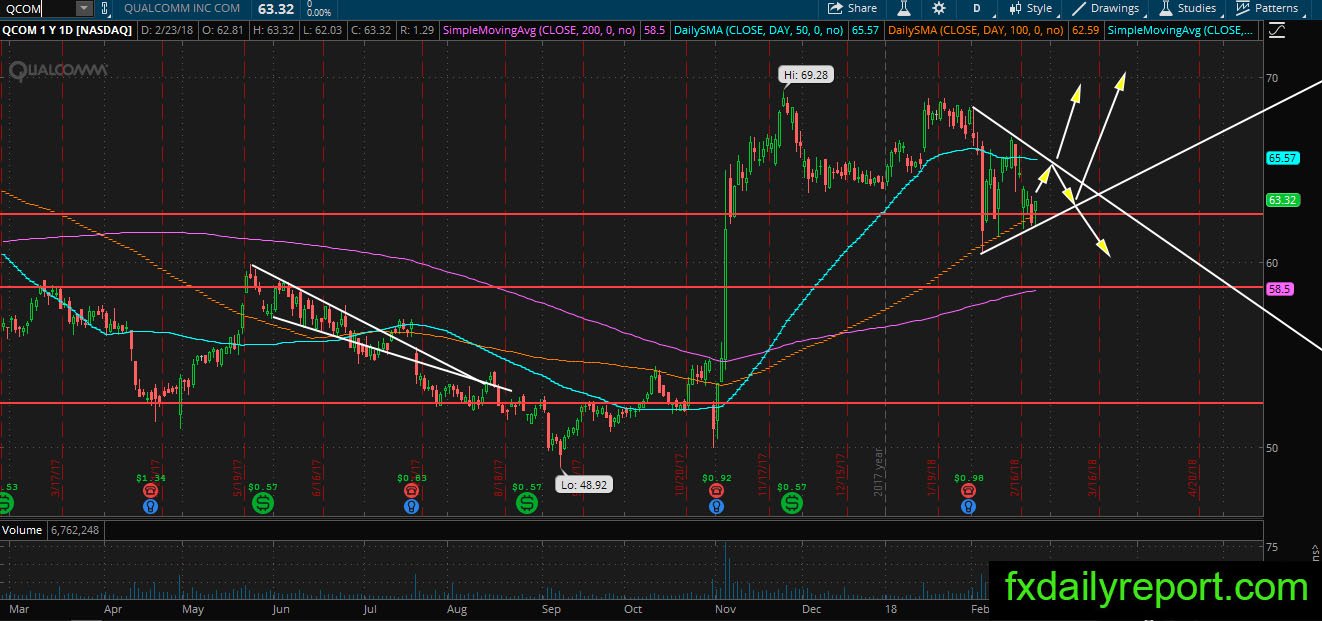
QCOM is trading inside triangle pattern after continuous drop toward the daily SMA 100. The share prices currently supported by the averages and support around $62.50. There is no direction yet, and QCOM might trade inside the triangle pattern shown on the chart. A long position could be taken between $62.00 – $62.50 with target SMA 50.