
Home Depot result pull the market down
The earnings result from Home Depot (NYSE: HD) send the DJIA futures down more than 100 points. For Q4 2018, the company reported eps of $2.25 vs. $2.16 expectation. Revenue comes out at $26.49 billion vs. $26.57 billion expectation.
Today, the market will focus on The Fed Jerome Powell testimony. Analysts see no change in the outlook which is no rate-hike for the near future but thinks the Fed might increase rate base on the inflation rate.
Asian & European Stock market

Asian stock market closed lower. Japan stock market down 78.84 points (-0.37%) to 21,449.39, China Shanghai Composite down 18.77 points (-0.67%) to 2,941.52, and Australia ASX 200 down 57.90 points (-0.94%) to 6,128.40. European stock market also follows lower. DAX Germany down 0.30%, UK FTSE down 1.16%, Euro STOXX600 down 0.19%.
Technical Analysis
Dow Jones Industrial Average (INDU)
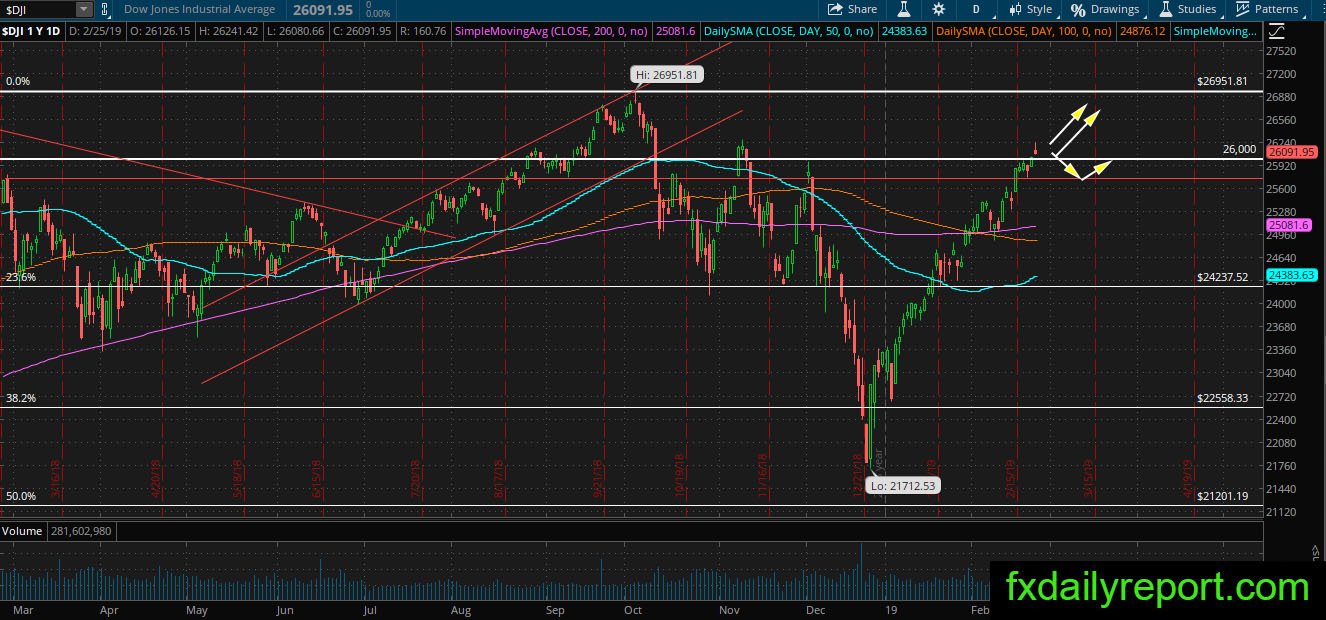
The optimism on trade talk brought DJIA to open higher yesterday. However, the upward pressure receives selling reaction and closed below its opening level. Currently, the index set to move lower and test the 26,000 support level. If the index could maintain the level above 26,000 then DJIA still has a chance to continue higher.
Canopy Growth Corporation (CGC)
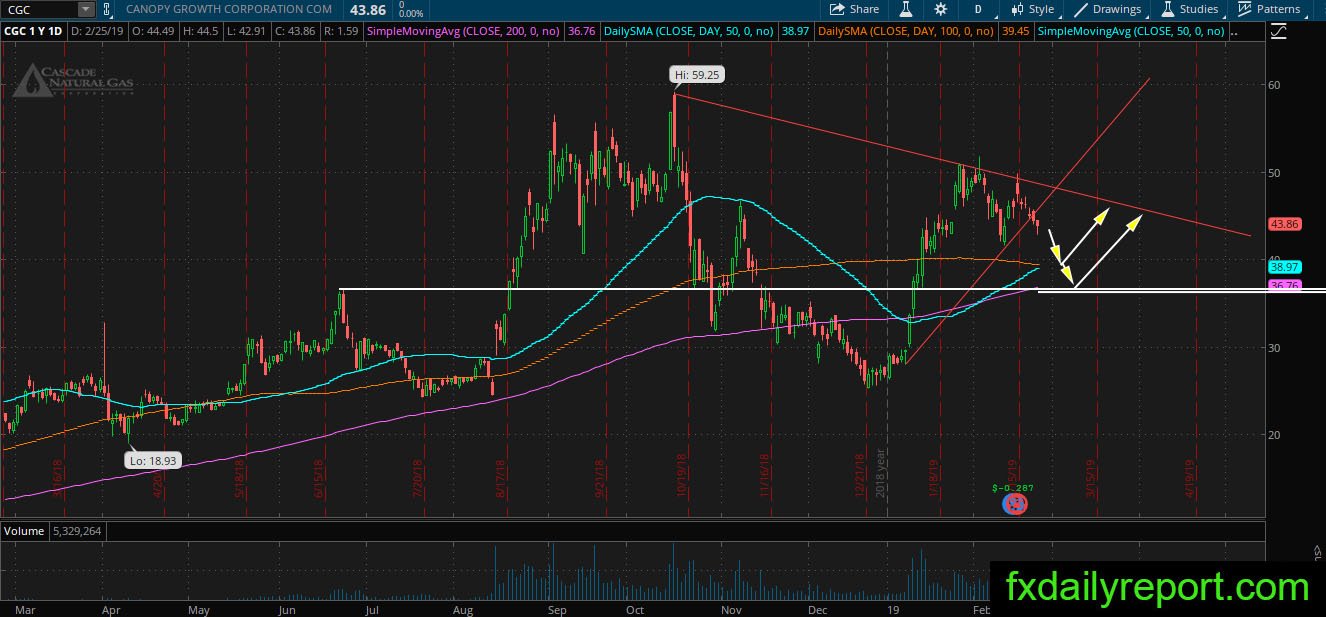
CGC broke below the triangle pattern shown on its daily chart. The breakout might accelerate and bring the share prices down to test SMA 100 & SMA 200. Traders could prepare for a long position when there is a bullish reaction near both support level.
LyondellBasell Industries (LYB)
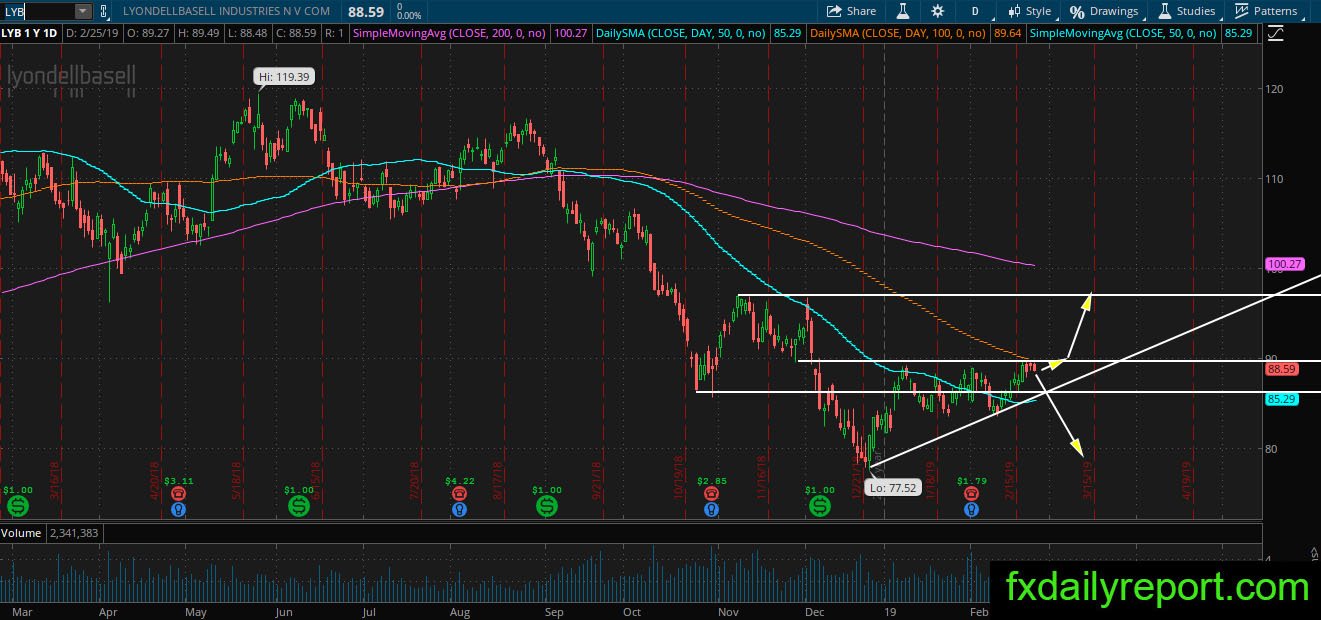
LYB is in a long-term bearish trend. However, the trend might have reversed when the share prices making a higher low. Currently, there is no higher high printed on the chart yet. LYB needs to break above $90.00 to print a higher high.
Despite the recent bullish outlook, there is daily SMA 100 which hinder the share prices from moving further upside. If LYB rejected from the averages and print strong bearish pattern then it might fall and test $77.52 in the long-term.