
Wall Street Falls as Hot Wholesale Inflation and Tech Weakness Shake Sentiment
U.S. equities slid sharply Friday after new inflation data showed wholesale prices rising more than expected, adding to tech sector weakness and cooling risk appetite. The Dow Jones Industrial Average plunged 605.90 points (-1.22%) to 48,893.30. The S&P 500 declined 54.00 points (-0.78%) to 6,854.86, while the Nasdaq Composite dropped 292.52 points (-1.28%) to 22,585.86.
Markets reacted negatively to the January Producer Price Index (PPI) report, which showed wholesale inflation increasing 0.5% month-over-month vs. the 0.3% forecast, and remaining elevated on a yearly basis. Core wholesale prices excluding food and energy also rose more than expected, highlighting persistent price pressures in services and production sectors. This reinforced concerns that inflation may remain stubborn and could delay any Federal Reserve rate cuts later this year.

Combined with renewed weakness in technology names — particularly AI-related and semiconductor stocks — the inflation surprise pressured broader equity sentiment. Traders are now weighing whether this sell-off represents a deeper shift in market trend or a short-term adjustment within the broader bull cycle.
Dow Jones Industrial Average (INDU)
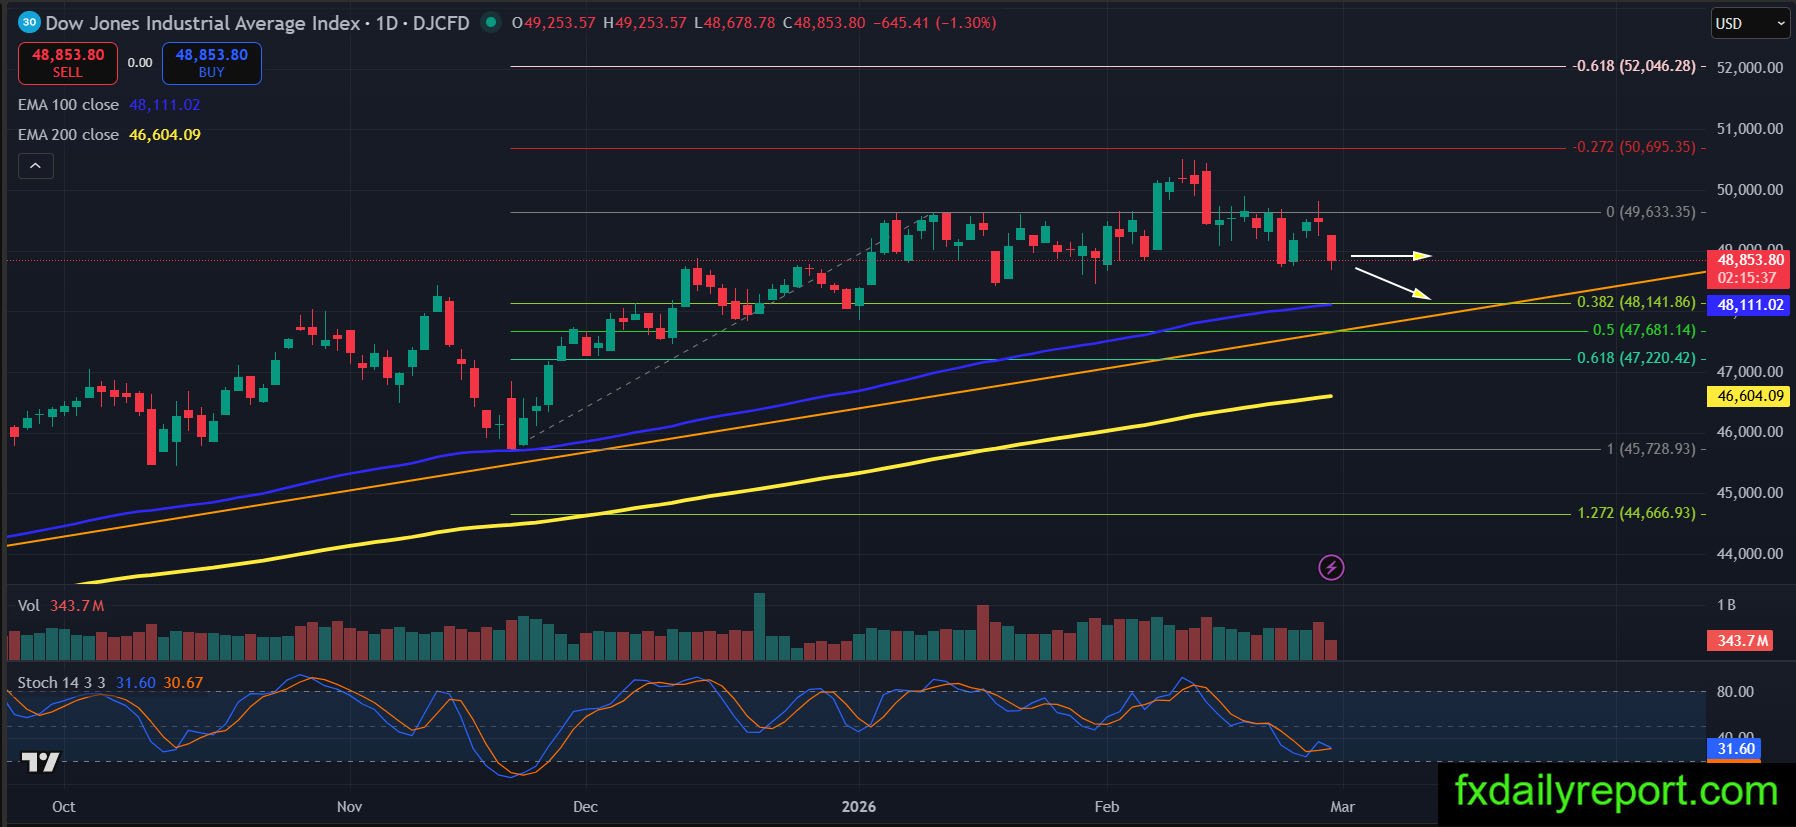
DJIA closed sharply lower after the inflation surprise and tech-led selling pressure. The index move lower and currently testing the weekly low. Despite today’s sell-off, the longer-term bullish structure has not yet been invalidated. The index is approaching the rising trend-line and the important support cluster near the 48,000–47,200 area. A bounce from this zone could still keep the primary uptrend intact. If the index continues lower and breaks below the rising trend-line, deeper corrective risk toward the EMA 200 and the 47,000 area would increase.
Brookfield Corporation (BN)
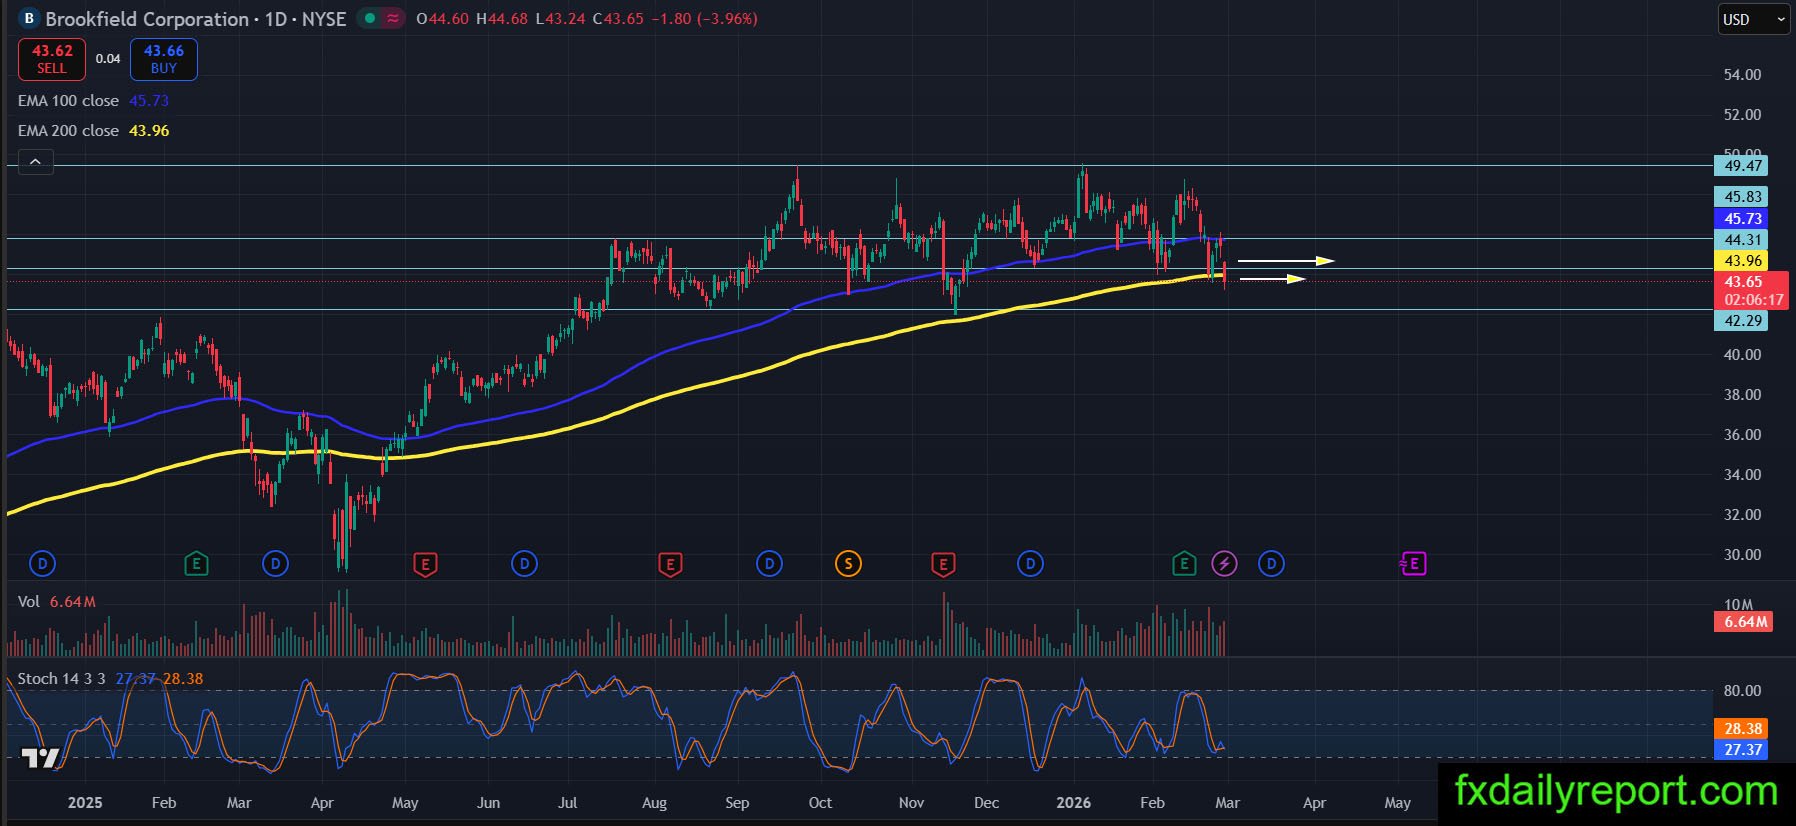
BN printed a strong bearish candle and is now trading below the EMA 100 while hovering around the EMA 200 zone. The stock failed to hold above the $44.31 – $45.83 area and sellers quickly regained control. The current price action suggests increasing downside pressure. The $42.29 level remains the key support for bounce. A breakdown below this level would potentially change the medium-term structure to bearish. On the upside, price needs to reclaim the EMA 100 and print a new higher swing high to restore bullish momentum. Overall, the share prices are consolidating between $42.00 – $50.00 and traders could use the range to plan positions.