
More sell-off in U.S stock market
The stock market in the U.S ready for another sell-off following the correction in the global stock market. Stronger job data at the close of previous week drive Dow Jones Industrial Averages down more than 600 points. The strong job data is an affirmation for the Fed to increase interest-rate. Aside from the data, earlier in the previous week 10-year treasury note is ticking up and hit as high as 2.88%. The event sent fear across the equity market.
This week, traders could expect possible rebound in U.S dollar and continuation of correction in the stock market.
Asian & European Stock market

Asian stock market trade lower today. Nikkei down 592.45 points (-2.55%) to 22,682.08, Shang Hai Composite up 25.30 points (+0.73%) to 3,487.38 and Australia ASX 200 down 95.20 points (-1.56%) to 6,026.20. European stock market also underwater. DAX Germany down 0.85%, FTSE UK down 1.13%, and Euro STOXX 600 down 1.37%.
Technical Analysis
Dow Jones Industrial Average (INDU)
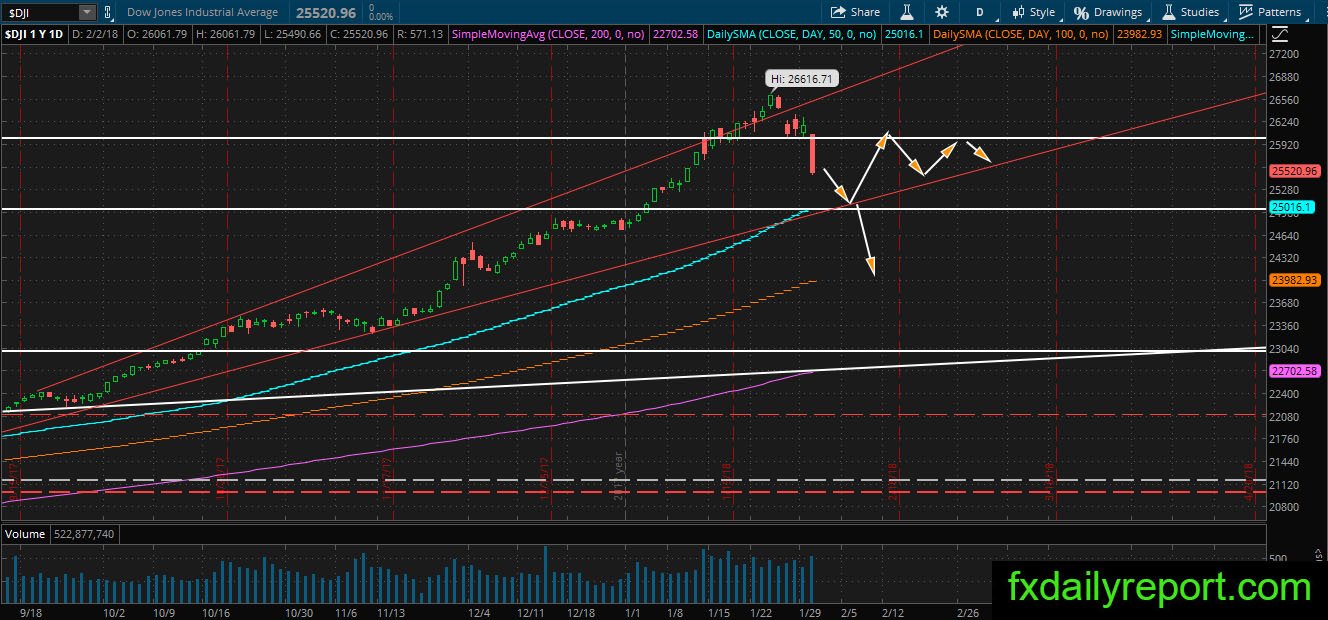
DJIA finally enter correction period after the index made sharp break below 26,000 handles and currently halfway from reaching 25,000. The index has strong bearish momentum and could reach the next support level in a matter of days. Today, the index futures slumped further with triple-digit losses. Will the index reach 25,000 today?
Schlumberger LTD (SLB)
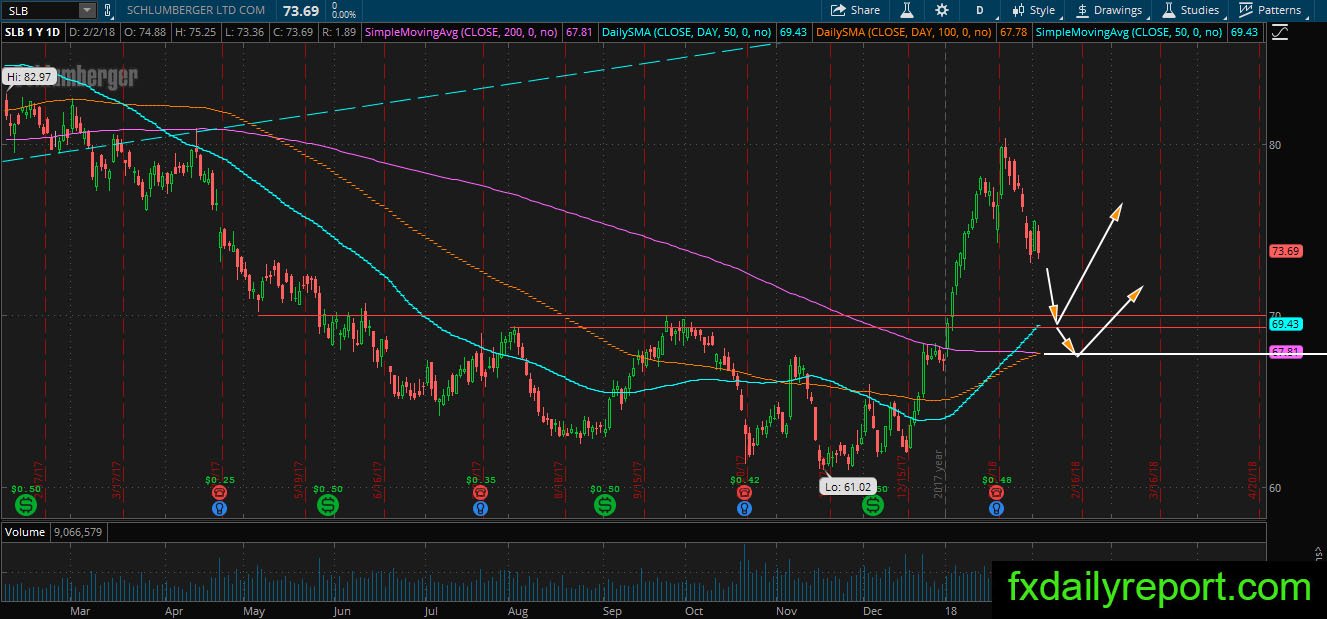
SLB share prices have broken free from daily SMA 200 upside. The share prices are back in an uptrend, but the global market situation is under correction period. Traders could watch level between $69.00 – $70.00 for a possible bounce. If the downward pressure is strong, the bear might push the price lower to the daily SMA 200.
Exxon Mobil Corporation (XOM)
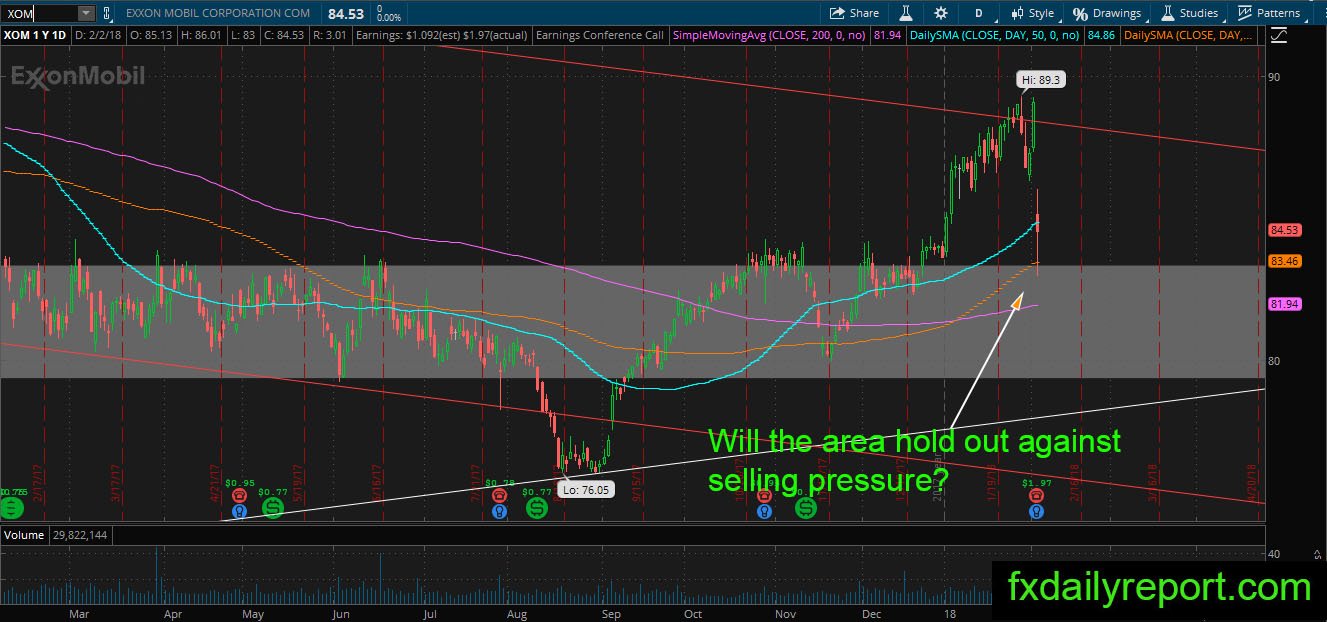
XOM previously limited below the grey area shown on the chart and managed to break above it. The share price hit long-term trendline and reversed after the earnings report. The company released its future oil outlook which is conflicting. On the one hand, XOM thinks oil demand will decline 20% by 2040, but at the same time, the company also provide a scenario that demand will increase 20%.
From the technical side, the grey area is area to look for a long position. Traders will watch the market reaction first and jump in when strong bullish reversal pattern formed.
Other Watchlist
MSFT – Watch for further weakness in the stock prices. $86.00 – $86.20 is an area to watch for a long position.