
U.S stock market jitter after bond yield rose
The stock market experiences sudden spook as bond yield tick up. The yield ticked up possibly caused by the change of stance in other central banks. ECB recently announce the possible change in its massive bond-buying following the strength of Europe economy. BOJ also made a move this week and might indicate the end of its stimulus-driven policy.
On another ground, Bloomberg reported China might be slowing or halting U.S bond purchase. This news later disputed by China regulator as “Fake.”

Today trading session might progress under many uncertainties, and the market might choose to stay sideline.
Cryptocurrency ban
Major cryptocurrencies such as Bitcoin, Ripple, and Ethereum suffer massive blow after South Korea in talks to ban digital coins trading. Bitcoin was down from $17,000+ last week to as low as $12,746 today.
Asian & European Stock market
Asian stock market traded mixed today. Nikkei down 77.77 points (-0.33%) to 23,710.43, Shang Hai Composite up 3.74 points (+0.11%) to 3,425.57 and Australia ASX 200 down 29.10 points (-0.48%) to 6,067.60. European stock market traded lower. DAX Germany down 0.51%, FTSE UK down 0.01%, and Euro STOXX 600 down 0.39%.
Technical Analysis
Dow Jones Industrial Average (INDU)
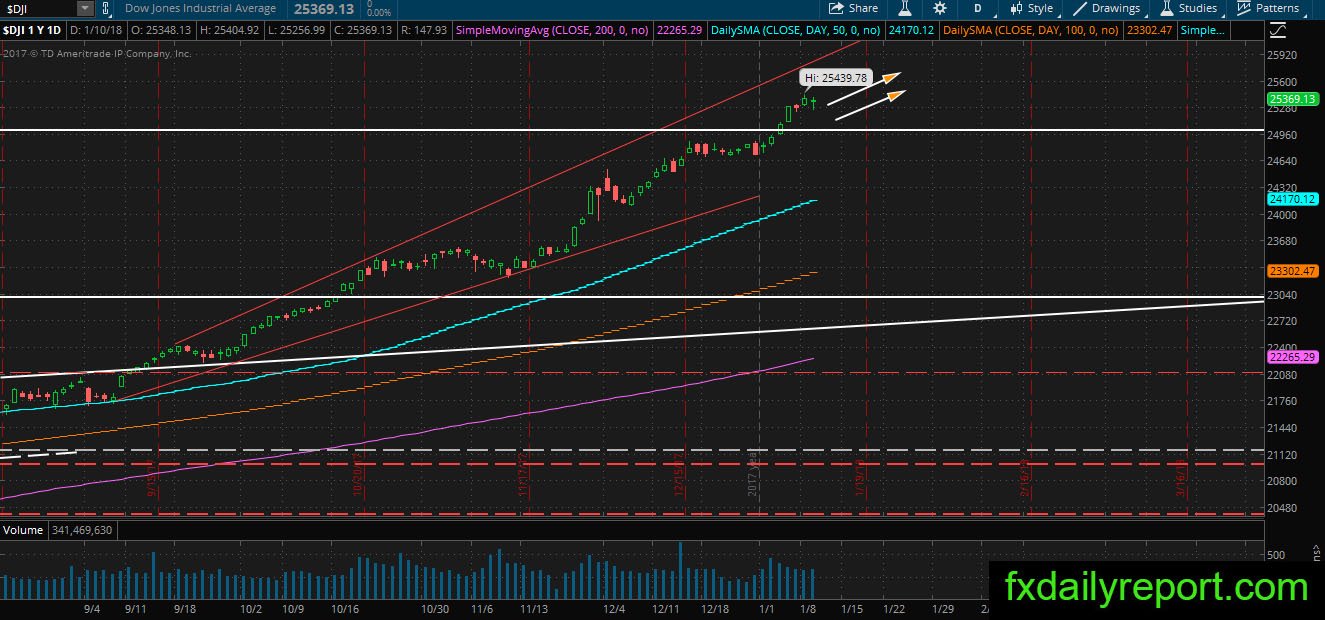
Even though the index futures pointed up more than 100 points before market open Yesterday, Dow Jones Industrial Averages opened lower and stay below the opening level until the end of trading day. Today, the index futures pointed up 36 points and indicate higher open. Will the index follow previous day scenario?
Ebay Inc (EBAY)

EBAY slide lower in the previous trading day following the new record high. There is no clear explanation for this drop yet aside from technical correction. From fundamental side, we might have an explanation as analysts think the company earnings will drop 74.82%.
Traders could watch a cluster of averages for a bullish hint before entering a long position.
Costco Wholesale (COST)
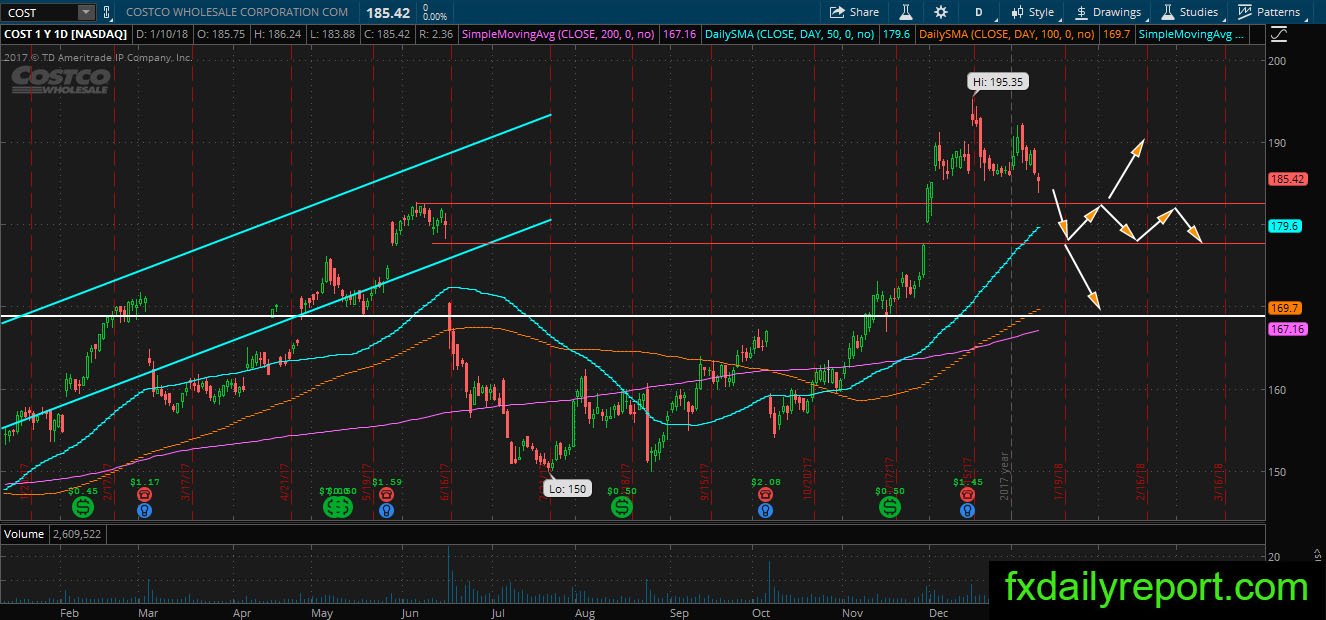
COST share prices undergo correction from the top and looks will continue and reach daily SMA 50. The area between $177 – $182 is the area of interest which might hold the price from further decline.