
U.S. stocks advancing after initial bearish pressure
U.S. equities faced pressure earlier in the session, with risk sentiment weighed down by lingering policy and rate-related concerns. However, selling interest faded as the session progressed, allowing buyers to step back in and drive a broad intraday recovery. Major indexes have since rebounded into positive territory, reflecting a market that remains resilient despite near-term uncertainty.
The Dow Jones Industrial Average and S&P 500 are now trading modestly higher, while the Nasdaq Composite is outperforming with a stronger advance. The rebound suggests that downside attempts are still being treated as opportunities to accumulate, rather than the start of a broader risk-off move.
Dow Jones Industrial Average (INDU)

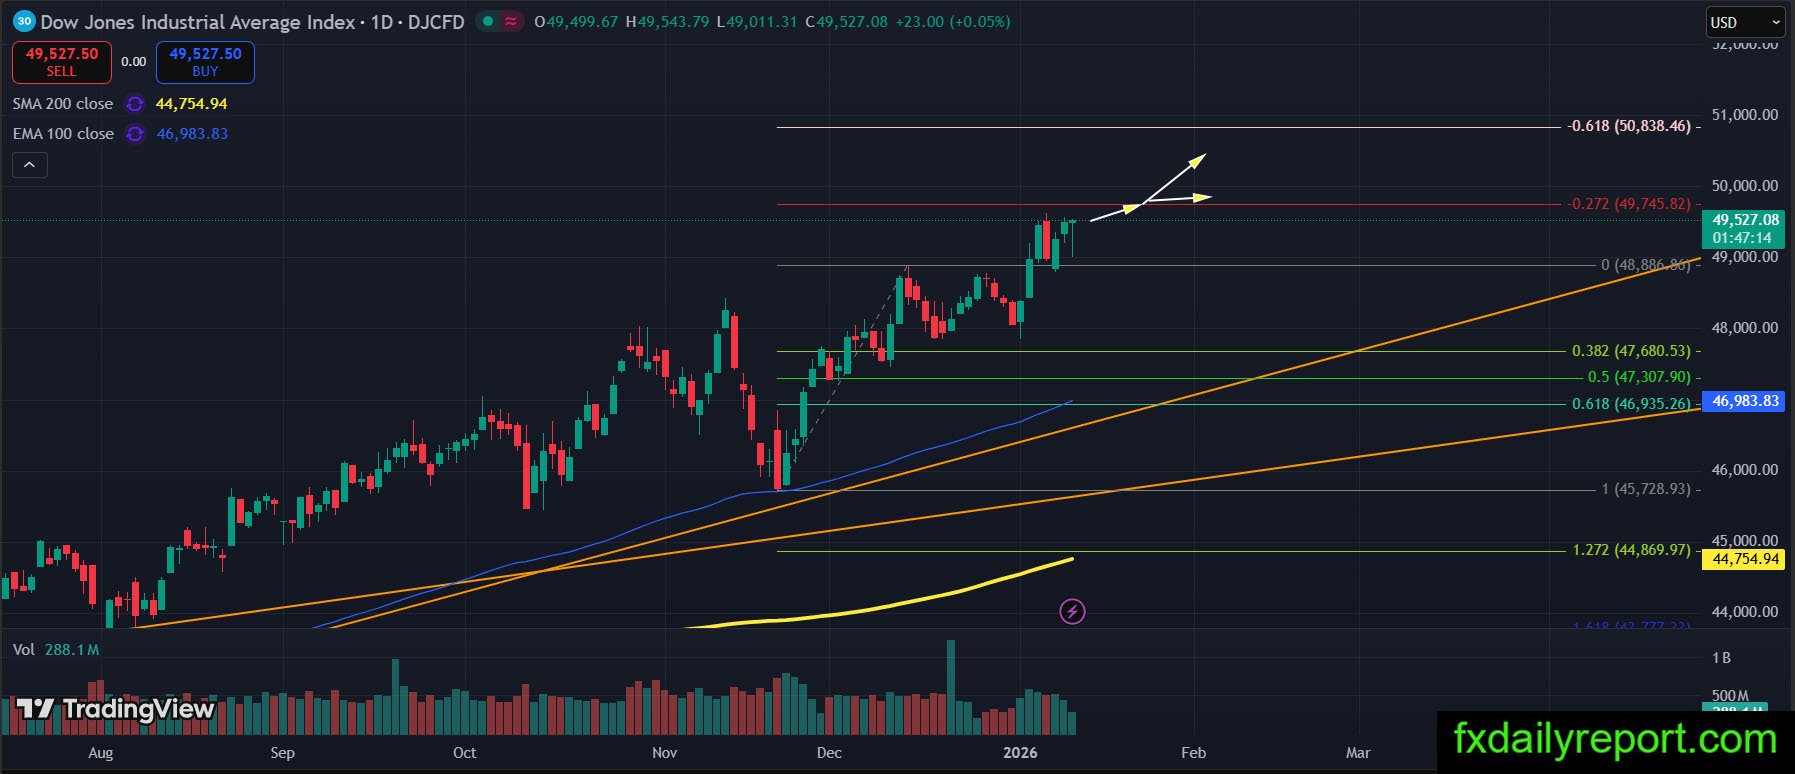
The DJIA is extending its upward structure after successfully absorbing earlier selling pressure. The index is currently consolidating just below the 127.2% Fibonacci extension area. A decisive break and daily close above this resistance would open the path for continuation toward the 50,000 level. Conversely, a failure to sustain current levels followed by a daily close below 48,886 would signal weakening momentum and raise the risk of a deeper corrective pullback. For now, the trend remains positive while this support holds.
Rigetti Computing, Inc. (RGTI)
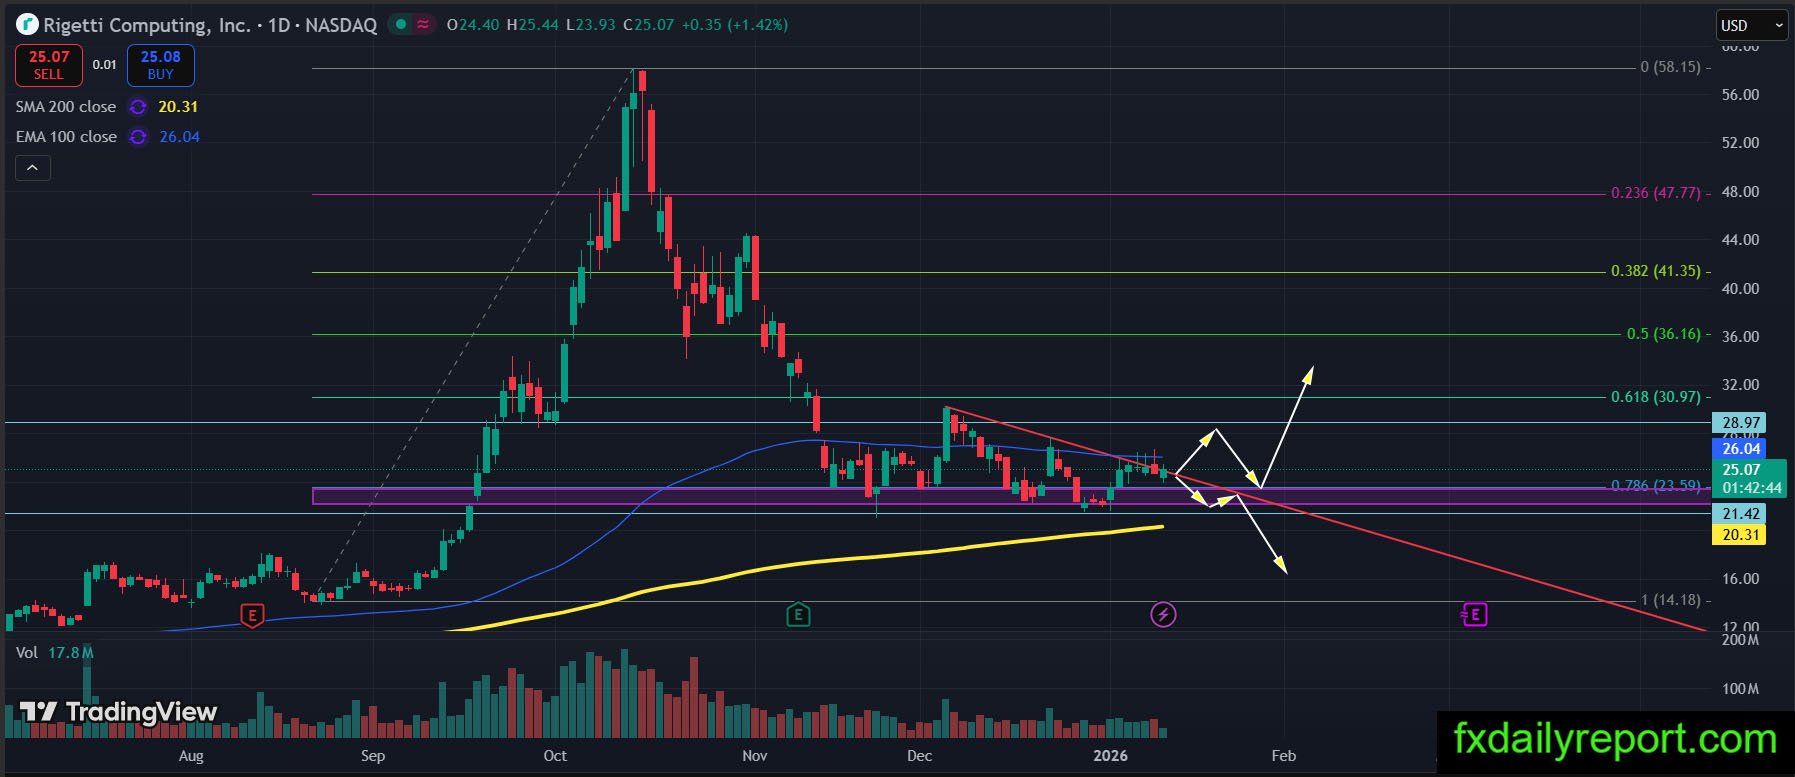
Shares of Rigetti Computing remain under bearish pressure in the broader context, but recent price action suggests selling momentum is slowing. The stock continues to trade below the daily EMA 100, keeping the short-term trend bearish.
Price is now hovering near a key confluence support zone, where Fibonacci retracement levels align with prior swing highs and lows. This area increases the likelihood of stabilization or base development. If the stock manages to hold this zone and starts forming higher lows, it would signal improving conditions for a potential rebound. A clear breakdown below support would invalidate the basing view and expose the stock to further downside.
Traders who want to enter long positions will place stop order below $20.00 or the daily SMA 200. On the upside, a breakout and close above EMA 100 & trend line will confirm the start of a bullish leg.