
Dow on track to print new record high
The upward movement of U.S stock indices left the bear baffled as new record high printed each day. One might be able to relate the bullish movement of the index to the dive in Cryptocurrency rate. Bitcoin lost more than 10% of its value today on the fear of South Korea ban.
There is no stop yet on the cryptocurreny decline. The only major corporate news to watch come from Citigroup (NYSE: C) and United Health Group (NYSE: UNH) which will report earnings before the market open.
Asian & European Stock market

Asian stock market traded higher today. Nikkei up 236.93 points (+1.00%) to 23,951.81, Shang Hai Composite up 27.00 points (+0.79%) to 3,437.48 and Australia ASX 200 down 28.50 points (-0.47%) to 6,048.60. European stock market also inched higher. DAX Germany up 0.69%, FTSE UK up 0.25%, and Euro STOXX 600 up 0.38%.
Technical Analysis
Dow Jones Industrial Average (INDU)
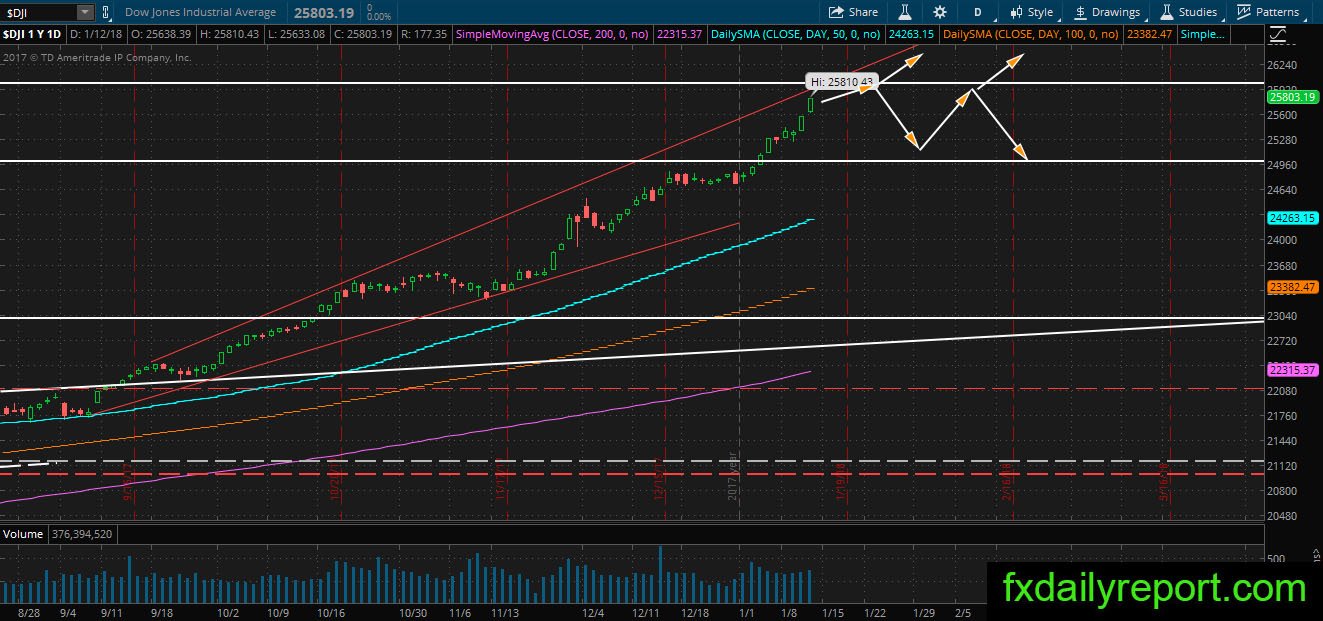
DJIA uptrend continues unshakeable, and the index position is less than 200 points below 26,000. Today, the index expected to open near the new milestone as DJIA futures up 245 points. Where will the index move next? Traders and investors will continue watch earnings report from companies this month before determining next direction.
Marsh & Mclennan Cos Inc (MMC)

MMC has support level between $80.00 – $80.50 and the share price currently testing it. The odds of a bounce is high as the support overlap with the trendline, and there is SMA 200 below the level. Traders could look for a long position with stop order below the daily SMA 200.
Other Watchlist
JWN – Surpass the $50.00 handle, it might continue higher with or without re-test of $50.00.
SAP – Watch the share prices reaction when it hit daily SMA 200.
JCP – Testing the daily SMA 200 and produce mini bearish candlestick. The test might continue, and breakout could happen.
QSR – Worth to watch if the share prices could bounce up and close above its daily SMA 200.