
U.S stock market turn on the positive side as companies set to report earnings result
The U.S stock market turned lower on Monday trading session but managed to recoup most of its losses. Today, traders will prepare for major earnings results. JNJ, AXP, GE, MMM are among the companies which will report earnings before the market open. AMD, MSFT, SBUX, and TXN will report earnings after the market close.
Aside from earnings reports, traders will also monitor the Fed closely as the central bank will begin two-days meetings to decide future policies on interest-rate.
Asian & European Stock market

The Asian stock market mostly lower today. Japan stock market down 276.11 points (-0.96%) to 28,546.18, China stock market down 54.81 points (-1.51%) to 3,569.43 and Australia ASX 200 closed. The European stock market takes a higher path. DAX Germany up 1.96%, UK FTSE up 0.87%, and Euro Stoxx600 up 1.07%.
Technical Analysis
Dow Jones Industrial Average (INDU)
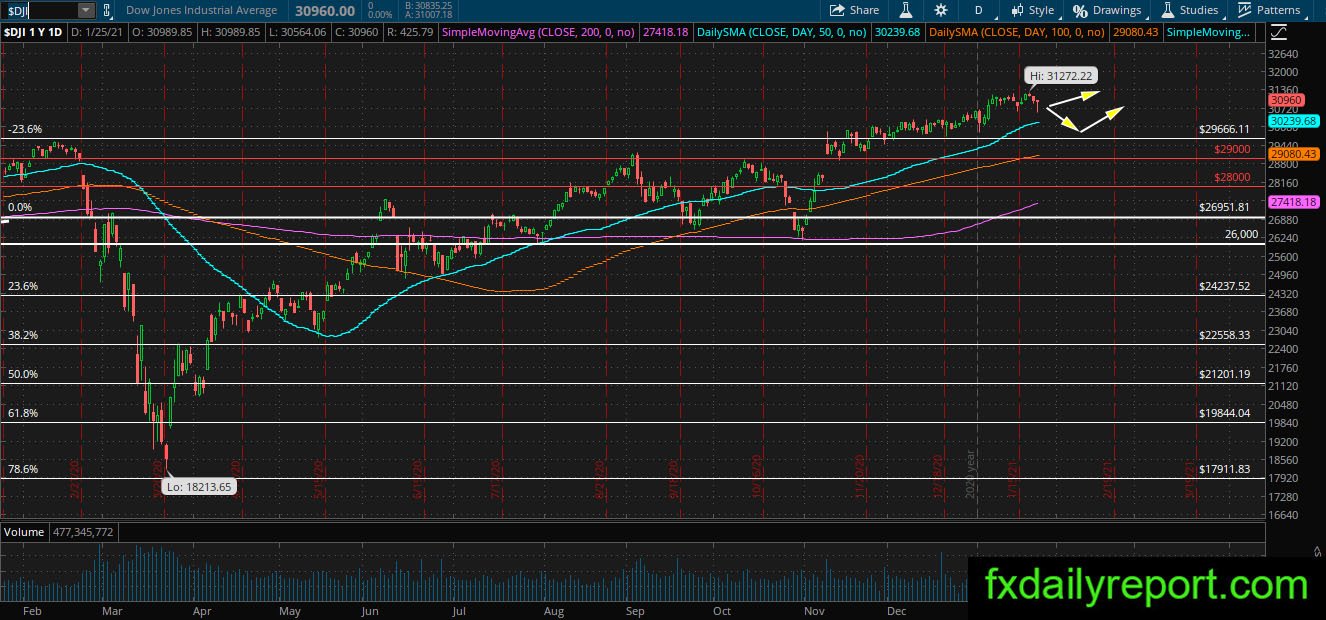
There was a major bearish movement yesterday in the DJIA index. However, the bearish pressure decreased and at the end of the day, the index could close the day on the positive side. The index futures currently higher 50 points which indicate a bullish trading day.
No strong clue yet on the index’s next direction, traders might want to continue to observe closely the index movement at the current level.
Union Pacific Corp (UNP)
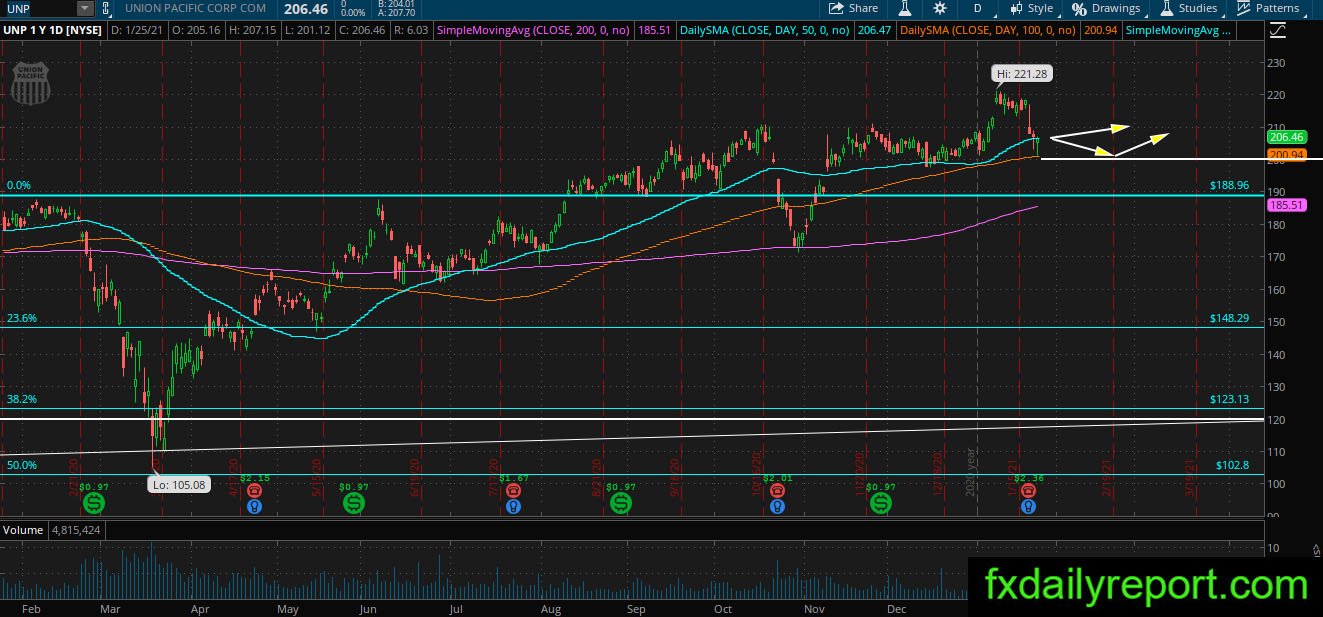
UNP share prices pulled back from $221.28 to daily SMA 50 & 100. The share prices tested the averages and printed a bullish pin bar pattern. The level also coincides with $200.00 handle which means there are high-odds that UNP will continue its bullish trend from the averages.
Traders who have long positions could continue to maintain it now. On the other hand, if the share prices move lower toward the daily SMA 200 then traders could observe and enter long positions near it.
Intel Corp (INTC)
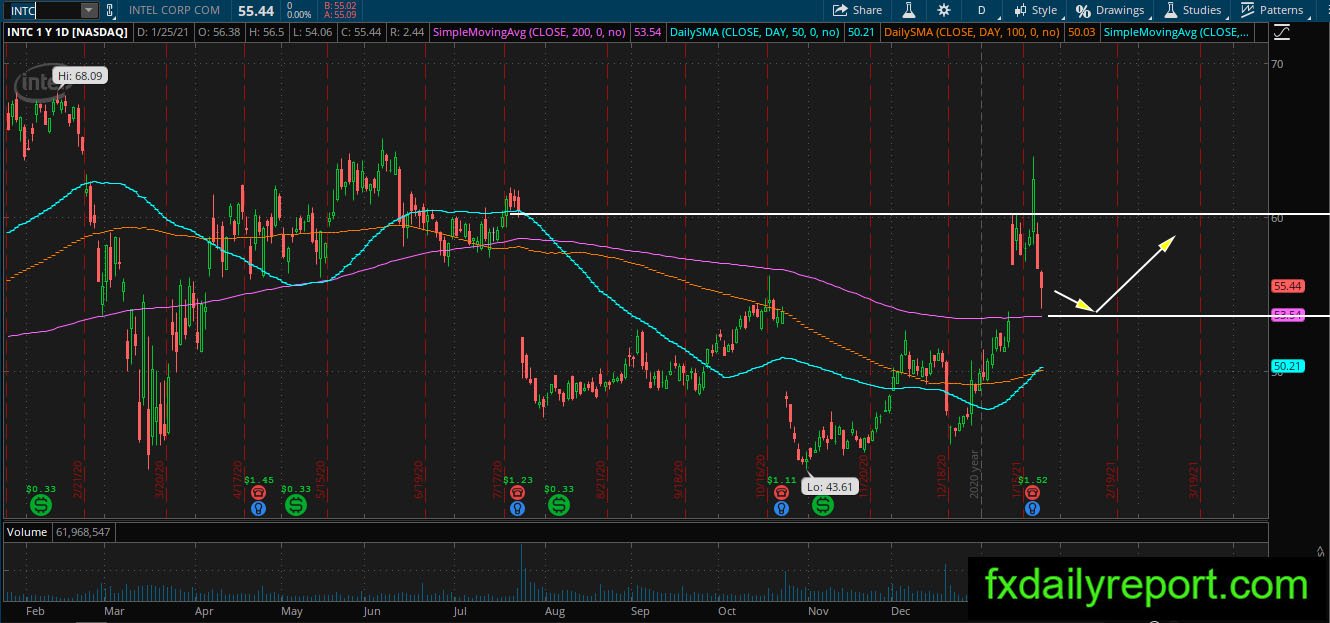
INTC share prices jumped above the daily SMA 200 and managed to close the bearish gaps shown on the chart. After the bearish gap closed, the share prices seem pushed lower and currently will test the daily SMA 200. If the share prices could maintain the position and bounce from the averages then traders will expect another bullish attempt on the gap level.