
U.S stock market set to trade lower
The surge in Coronavirus cases put the reopening of the economy under halt but the shares in the technology sector exhibiting different behavior. While most of the shares in other sectors hit by bearish pressure, we have seen the technology sector defying the bearish pressure and keep moving higher.
It will take a long-time for the economy to recover but technology sector might be in a different dimension in the current situation. Nevertheless, DJIA futures currently lower more than 173 points.

Surprise comes from the European region as French and Italian industrial output posted a larger growth of 19.6% and 42.1% m/m compared to 15.2% and 23.5% expectation. U.S stock market futures gradually move higher and might erase all of its losses before the market open.
Asian & European Stock market
The Asian stock market clouded by bearish pressure. Japan stock market down 238.48 points (-1.06%) to 22,290.81, China stock market down 67.27 points (-1.95%) to 3,383.32 and Australia ASX 200 down 36.30 points (-0.61%) to 5,919.20. The European stock market notably higher. DAX Germany up 0.49%, FTSE UK up 0.35%, Euro STOXX 600 up 0.43%
Technical Analysis
Dow Jones Industrial Average (INDU)
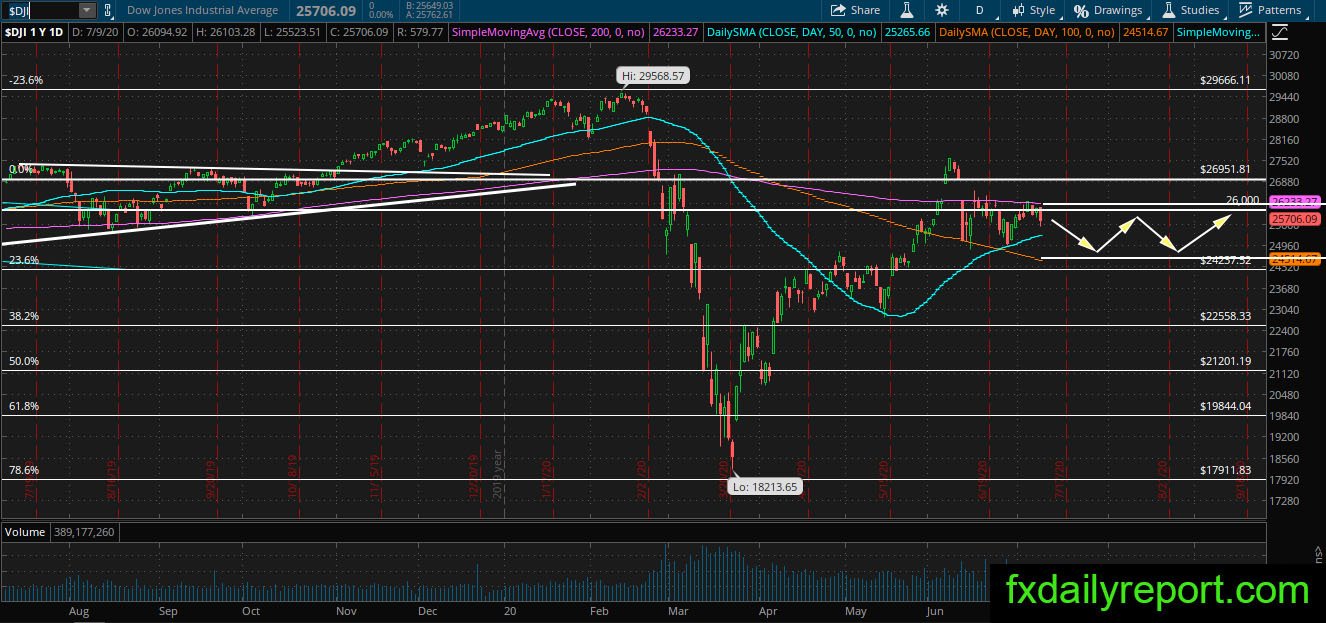
The bearish reaction from the daily SMA 200 slowly takes place and DJIA starts moving lower from the averages. No change to the outlook, the index expected to continue trade between the daily SMA 100 & 200. Currently, DJIA futures lower 173 points, suggesting further weakness.
If the index reaches daily SMA 100 then traders will expect another bounce from it.
Paccar Inc (PCAR)
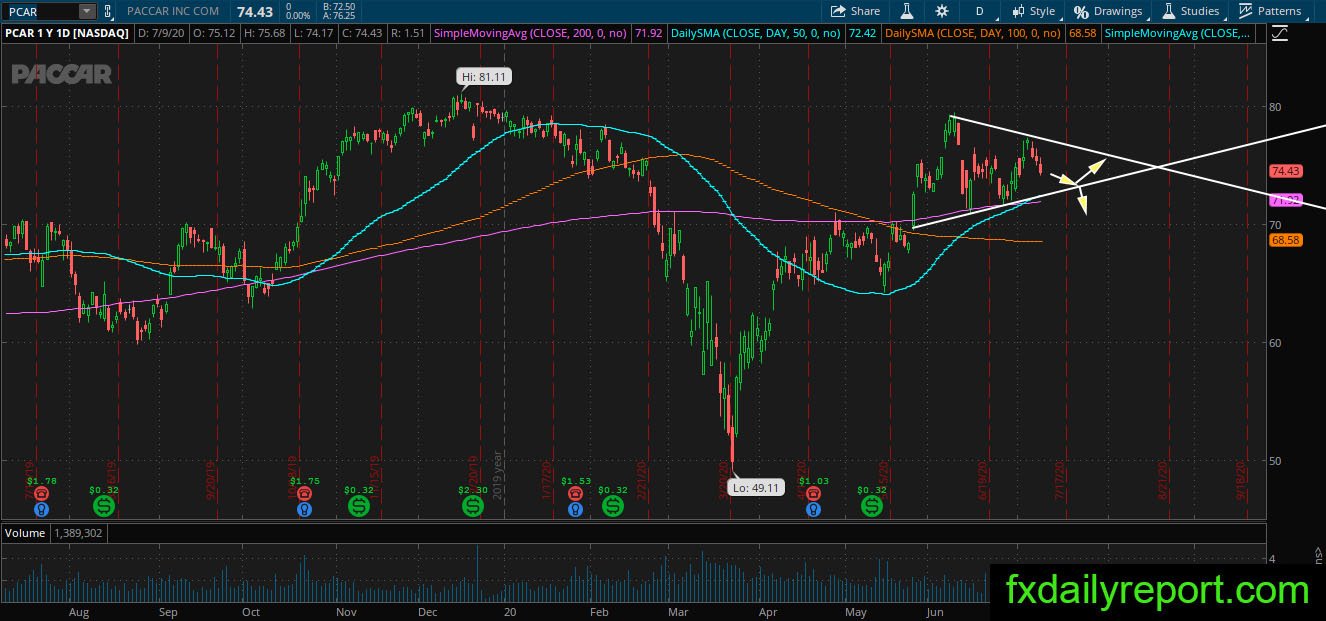
PCAR share prices have climbed above the daily SMA 200 and keeping its bullish pressure intact. The share prices look trading inside a triangle pattern. At the current time, it is moving lower and soon will reach the bottom of the triangle.
Traders will expect triangle consolidation to continue for now. If the bearish breakout happens then daily SMA 200 will become the level to watch for a possible bounce.