
U.S stock market set to trip after the opening bell
The stock market in the U.S will open down but not far from previous week close. Dow Jones Industrial Averages futures currently traded down 13 points. The major news comes from the trade wars issue as President Trump ready to slap tariffs on up to $505 billion Chinese goods.
The President also threaten Iran’s President Rouhani to stop threatening the United States; otherwise, the country will suffer consequences. The hostile tension between Iran and U.S continue to elevate and drive traders, investors to safe-haven assets.
Asian & European Stock market

Asian stock closed mixed. Nikkei closed down 300.89 points (-1.33%) to 22,396.99, Shang Hai Composite closed up 30.25 points (+1.07%) to 2,859.52 and Australia ASX 200 down 58.30 points (-0.93%) to 6,227.60. European stock off to the lower part on trade fear. DAX Germany down 0.15%, FTSE UK down 0.17%, and Euro STOXX 600 down 0.11%.
Technical Analysis
Dow Jones Industrial Average (INDU)

Dow Jones Industrial Averages end the week at the trendline resistance and provide us with the wait and see outlook. The index expected to test the resistance and either breakout or rejected. Nothing to do at the moment, traders will stay sideline.
Delta Airlines (DAL)
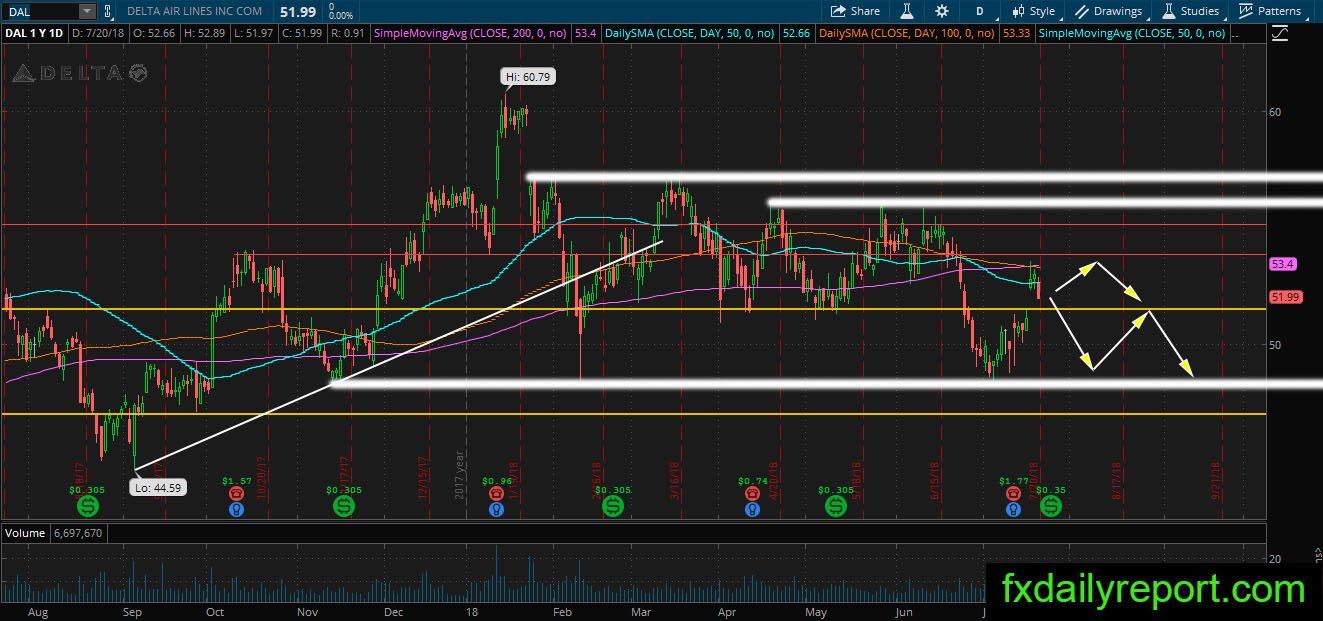
DAL is located at an interesting place, the daily SMA 200. There is an initial sign of rejection from the averages, and it is possible for the share prices to resume its bearish move. However, there is $50.00 psychological level which could hinder downside. Traders who place short position need to watch the price reaction near $50.00.
Hasbro Inc (HAS)
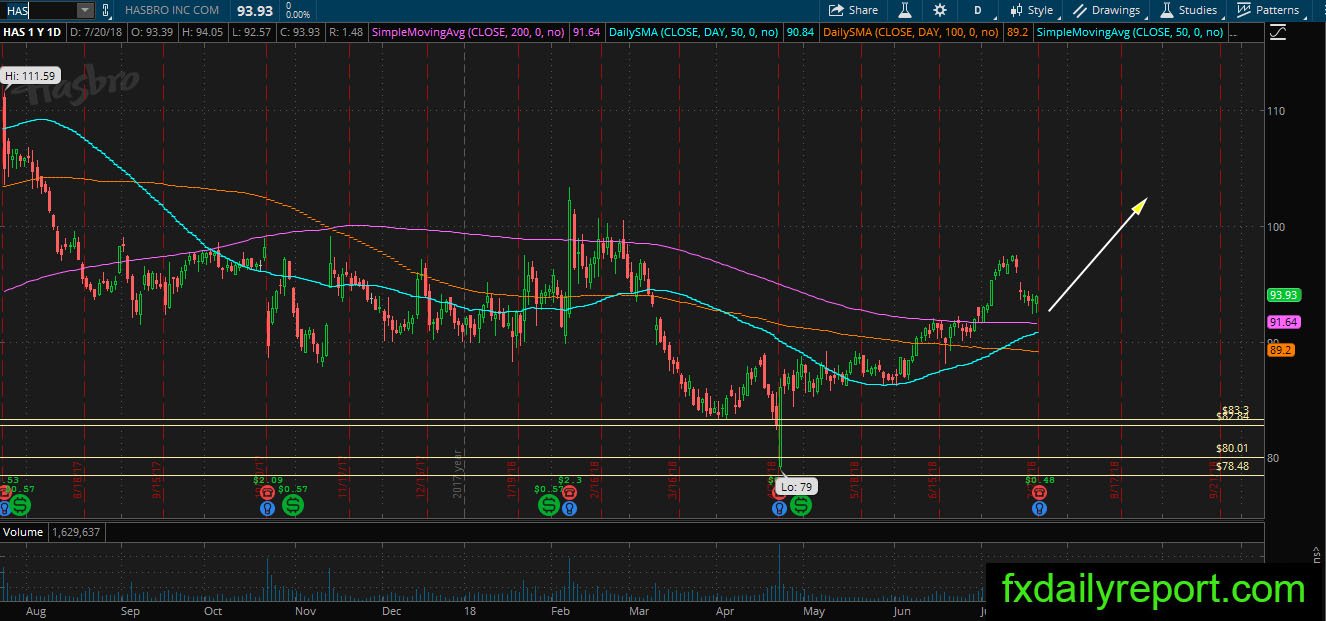
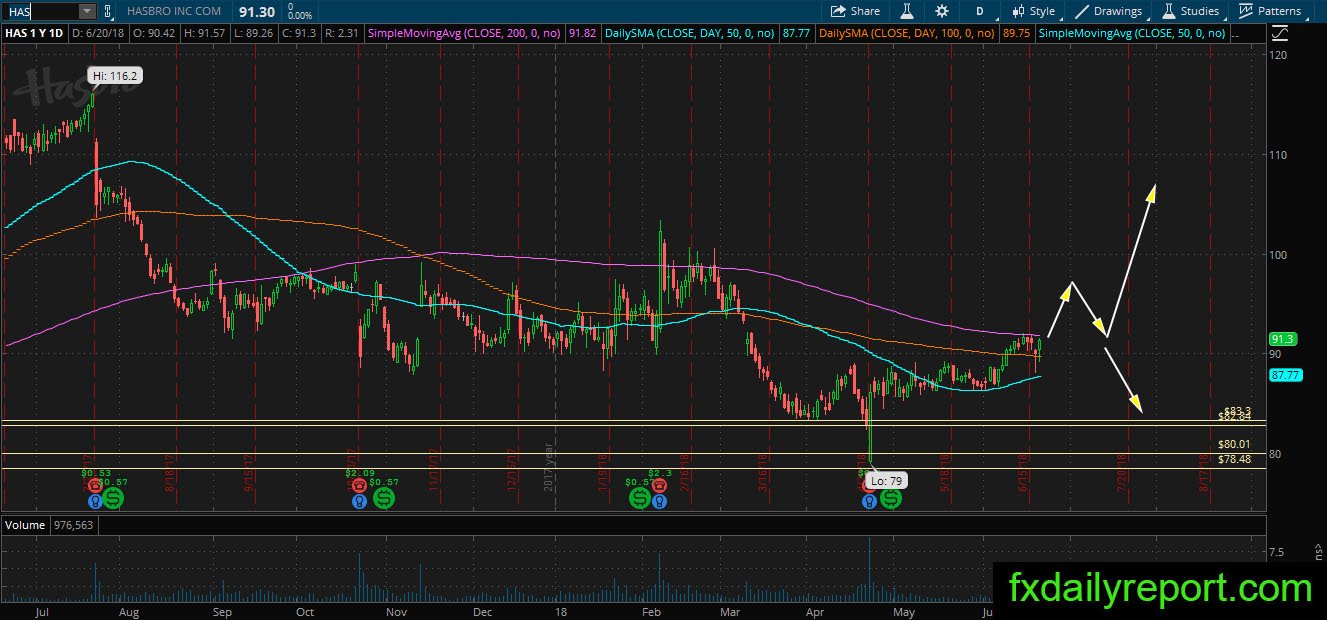
Traders who wait for a breakout above the daily SMA 200 in HAS. Now has the opportunity to take a long position. Currently, the share prices hovering near the SMA 200 after breakout and correction. If the bull could maintain the position above the averages, then we should see more bullish continuation soon. (Edit: Share prices has jumped 11% in pre-market after earnings reports, a long position not suggested until pullback happen)
Yelp Inc (YELP)
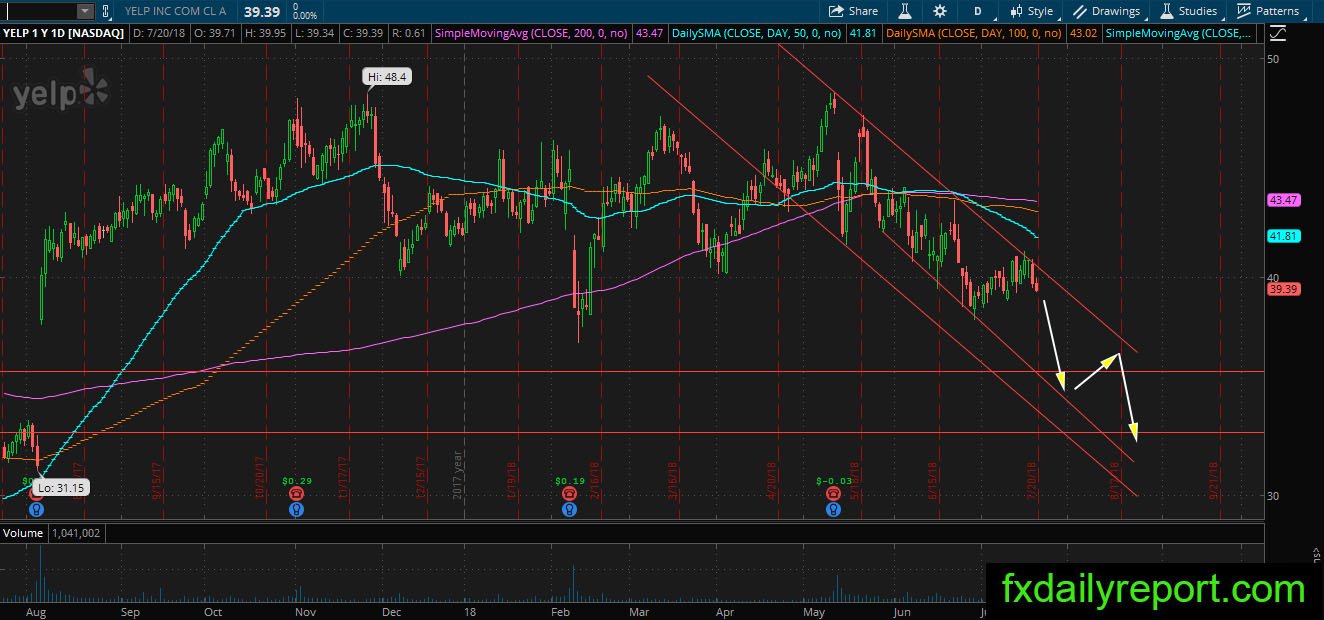

YELP is moving down as projected in June chart, and the share prices also follow the track downside in the bearish channel. We have another chance to ride the short position as YELP currently traded near the top of its bearish channel. Will the share prices respect the channel and continue moving inside it?