
Alphabet to pull DJIA up
U.S stock market set to climb on Tuesday is driven by Alphabet (NASDAQ: GOOG) strong earnings report after Monday market close. At the current time, DJIA futures up more than 100 points, also supported by strong earnings in Europe.
The market will watch reports from companies before market open. Harley-Davidson (NYSE: HOG), Kimberly-Clark (NYSE: KMB), Eli Lilly (NYSE: LLY), Lockheed Martin (NYSE: LMT), 3M (NYSE: MMM) and Verizon (NYSE: VZ) are among the companies which will report before the market open.

Aside from earnings, investors will keep monitoring trade spat between U.S-China also allies such as the European Union. Growing tension will limit the upside in the equity market.
Asian & European Stock market
Asian stock closed strongly upside. Nikkei closed up 113.49 points (+0.51%) to 22,510.48, Shang Hai Composite closed up 46.40 points (+1.62%) to 2,905.94 and Australia ASX 200 up 38.20 points (+0.61%) to 6,265.80. European stock launch on strong earnings. DAX Germany up 1.42%, FTSE UK up 0.77%, and Euro STOXX 600 up 0.91%.
Technical Analysis
Dow Jones Industrial Average (INDU)

Dow Jones Industrial Averages has not left the triangle pattern on its daily chart. The index expected to continue traded sideways near the top trendline. Better than expected earnings result from companies helped the index to stay at high. However, trade fears and rising tension between U.S-Iran hold the index from further upside.
We will continue to monitor the index movement inside the triangle.
L3 Technologies Inc (LLL)
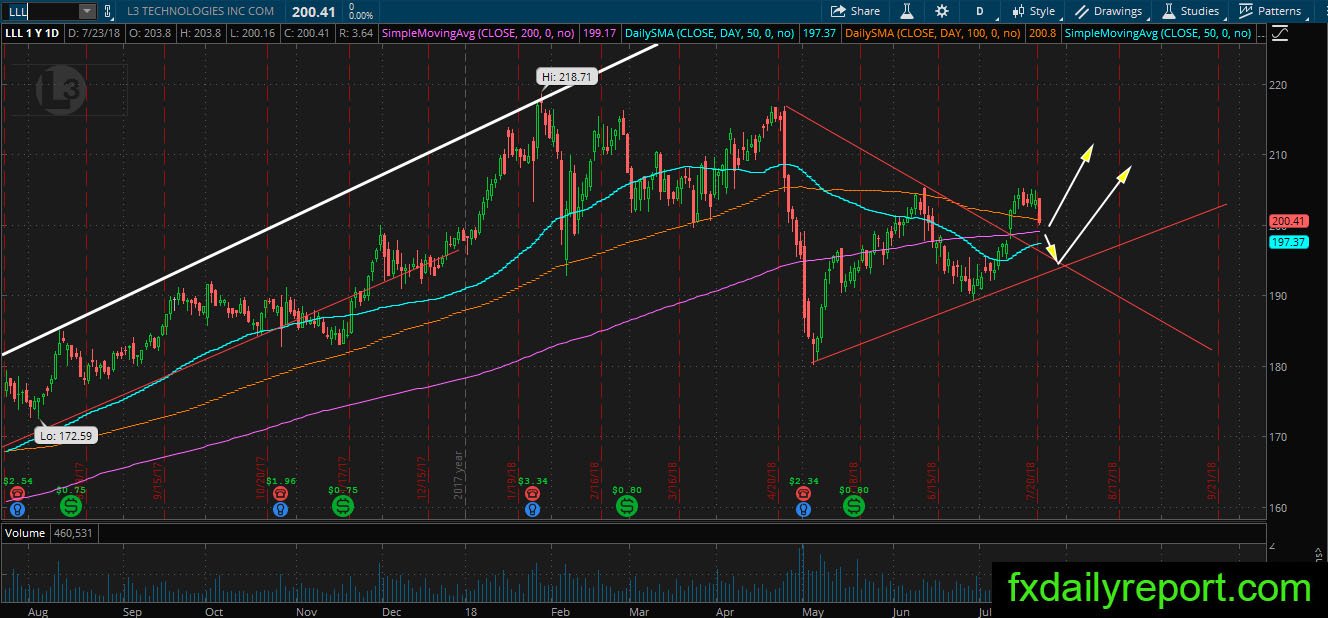
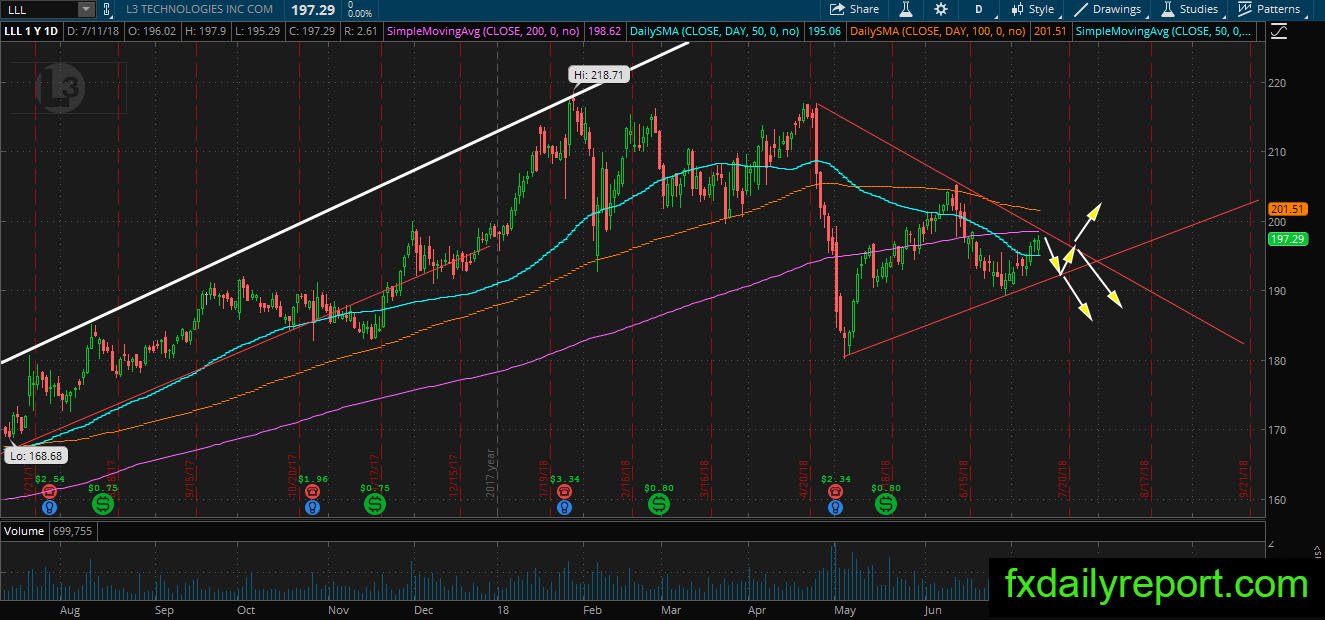
LLL breakthrough above the triangle pattern we mentioned at the middle of July. The share prices currently in corrective movement and almost reach the daily SMA 200. If the bull could print a bullish pattern near the SMA 200, then LLL has the opportunity to continue its recent uptrend.
Micron Technology (MU)

MU consistently moved upside after it tests the uptrend line on the daily chart. Currently, the share prices are testing the trendline again and expected to bounce from it. The bounce from trendline will lead to a test of the top trendline. Outlook will span inside the triangle pattern, which side will break first?