
Boeing and Caterpillar to drag the market lower
DJIA futures down more than 100 points before market open after Boeing and Caterpillar results disappoint the market. Boeing reported a loss per share of $5.82 vs. analyst expectation of $1.87 earnings per share. Revenue comes out at $15.8 billion vs. $18.6 billion expectation. The massive losses caused by charge while 737 max planes grounded worldwide. It is not clear yet when the plane could return to flight.
Caterpillar reported eps of $2.82 vs. $3.12 expectation. Revenue comes out at $14.432 billion vs. $14.435 billion expectation. Share prices down nearly 3% before the market open.
Asian & European Stock market

Asian stock traded mostly higher. Japan’s Nikkei up 88.69 points (+0.41%) to 21,709.57, China stock market up 23.33 (+0.80%) to 2,923.28, and Australia ASX 200 up 52.10 points (+0.77%) to 6,776.70. European stock market mostly lower. DAX Germany up 0.32%, UK FTSE down 0.81%, Euro STOXX600 down 0.10%.
Technical Analysis
Dow Jones Industrial Average (INDU)
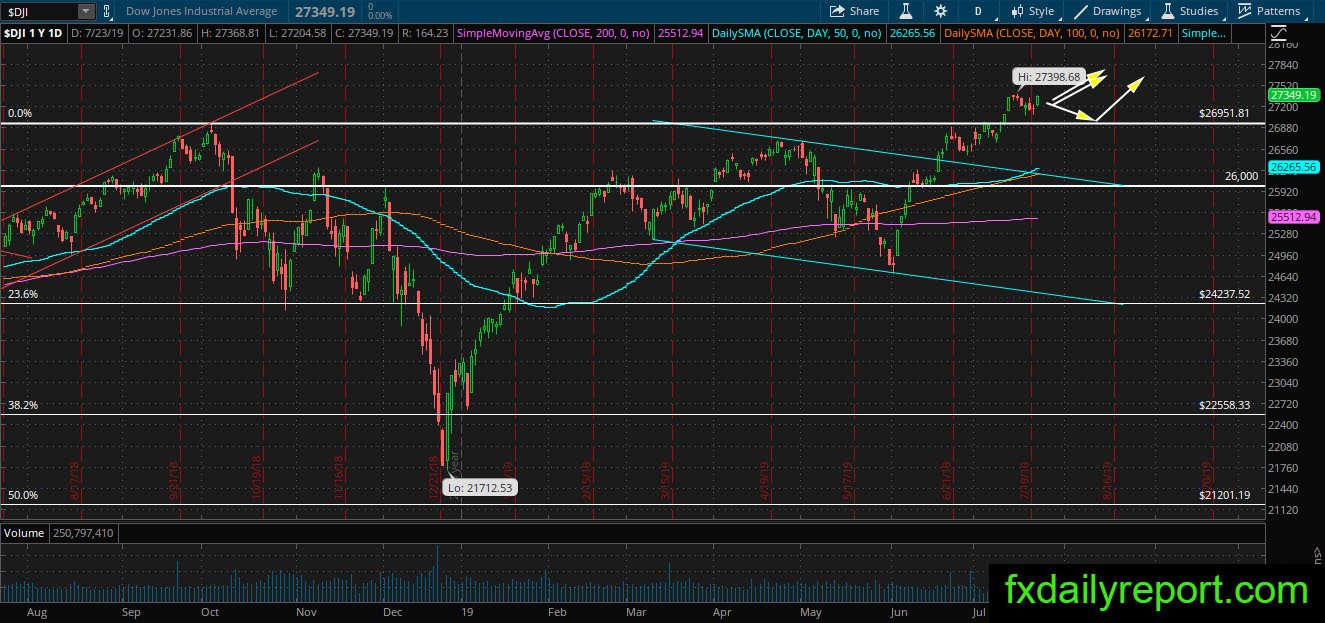
DJIA notch gain in the previous trading day and might print another all-time high. The market focus on earnings releases this week while the Fed interest-rate decision loom. At the current time, it is better to stay sideline and waiting for the result of an interest-rate decision next week. However, if a correction toward 27,000 happens then traders could observe the reaction and enter long positions in equity when there is a bullish reaction.
Archer Daniels Midland Co (ADM)
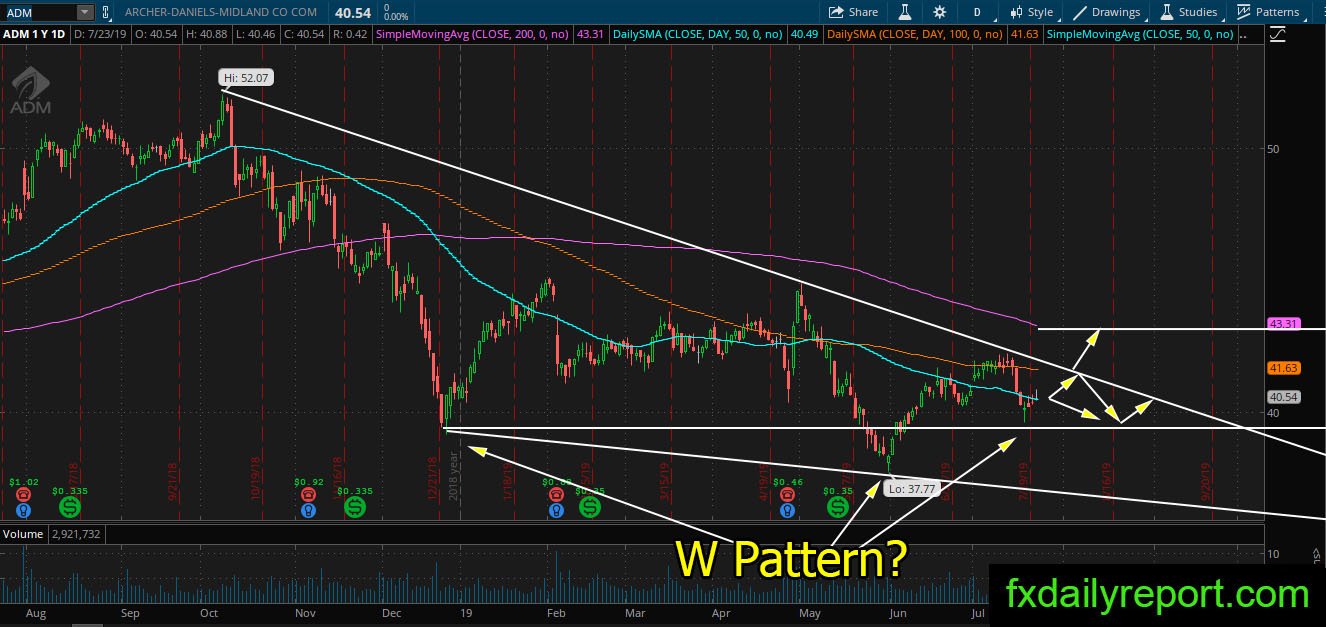
ADM share prices have a possible bullish W pattern and become interesting at the moment. The share prices also rejected from the bearish trendline recently. It looks like ADM might trade between trendline and support around $39.5. Will a bullish breakout happens and ADM starts moving upside to test daily SMA 200?
Keurig DR Pepper Inc(KDP)
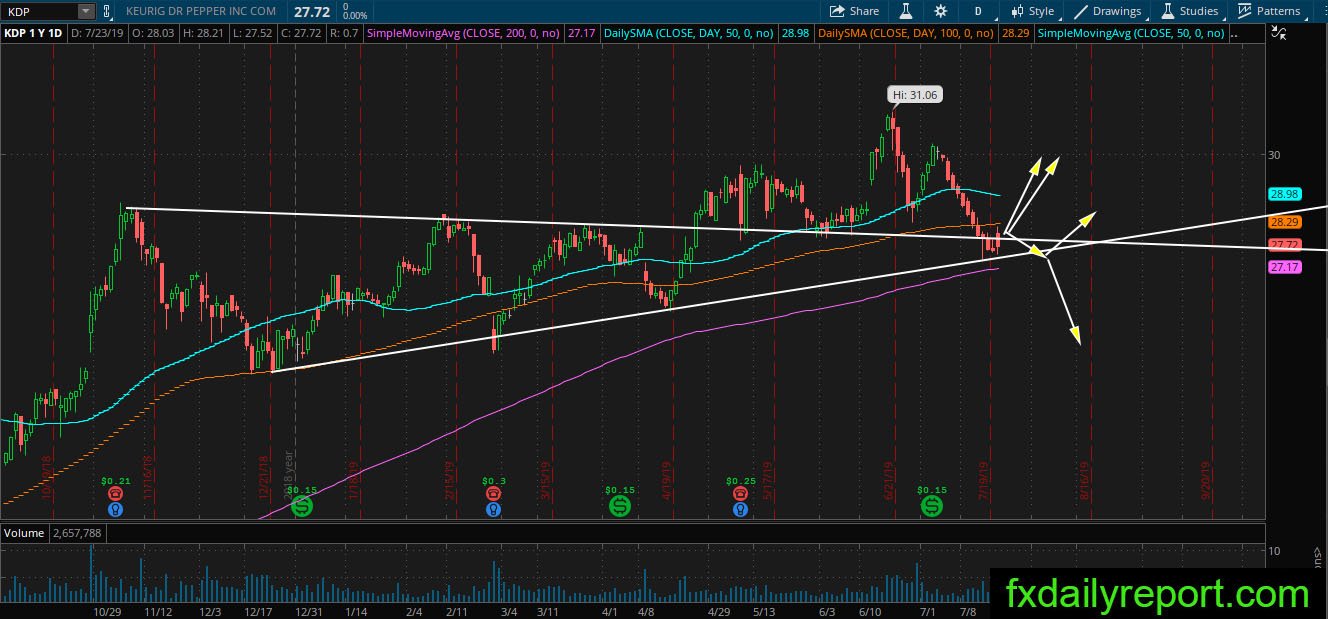
KDP slowly move lower since the previous upswing. No bullish candlestick printed on the chart yet, but there is reaction near the trendline and daily SMA 200. If the share prices could print a bullish candlestick after the test then we might see KDP start moving upward.