
DJIA futures hovering lower indicate lower open
The jump in Dow Jones Industrial Averages index in the previous day trading session put the index just 200 points below 22,000. Currently, the index futures slightly lower 30 points before market open and indicate the market will open lower today. Traders and investors are waiting for advance GDP data which expected to come out at 2.5% annualized.
Amazon (NASDAQ: AMZN) result brought the share price lower, and it is projected to lead tech stock lower today. Early this morning, Senate vote against the effort to repeal Obamacare which dimmed the prospect of President Trump ability to deliver policies.
Earnings & Corporate report

Merck & Co (NYSE: MRK) reported earnings per share of $1.01 vs. $0.87 consensus. Revenue comes out at $9.93 billion vs. $9.75 billion expectation. Share prices up to $64.5 in pre-market trading session.
Expedia stock price target raised to $173 from $158 at Piper Jaffray
Twitter stock price target raised to $14 from $13 at RBC Capital
Intel stock price target raised to $39 from $38 at SunTrust RH
MasterCard stock price target raised to $145 from $135 at SunTrust RH
XOM, CVX, MRK, ABBV, TRP, LYB, HCN, BEN, WY, IMO, AAL, VTR scheduled to report earnings pre-market
Other market
Asian stock market mostly lower in today trading session. The bounce of U.S dollar and stumbled tech stocks from U.S trading session might be the reason of pullback. European trading session also painted red with DAX, FTSE and Euro STOXX 600 retreat 0.45%, 0.65%, and 0.92% respectively.
Technical Analysis
Dow Jones Industrial Averages (INDU)
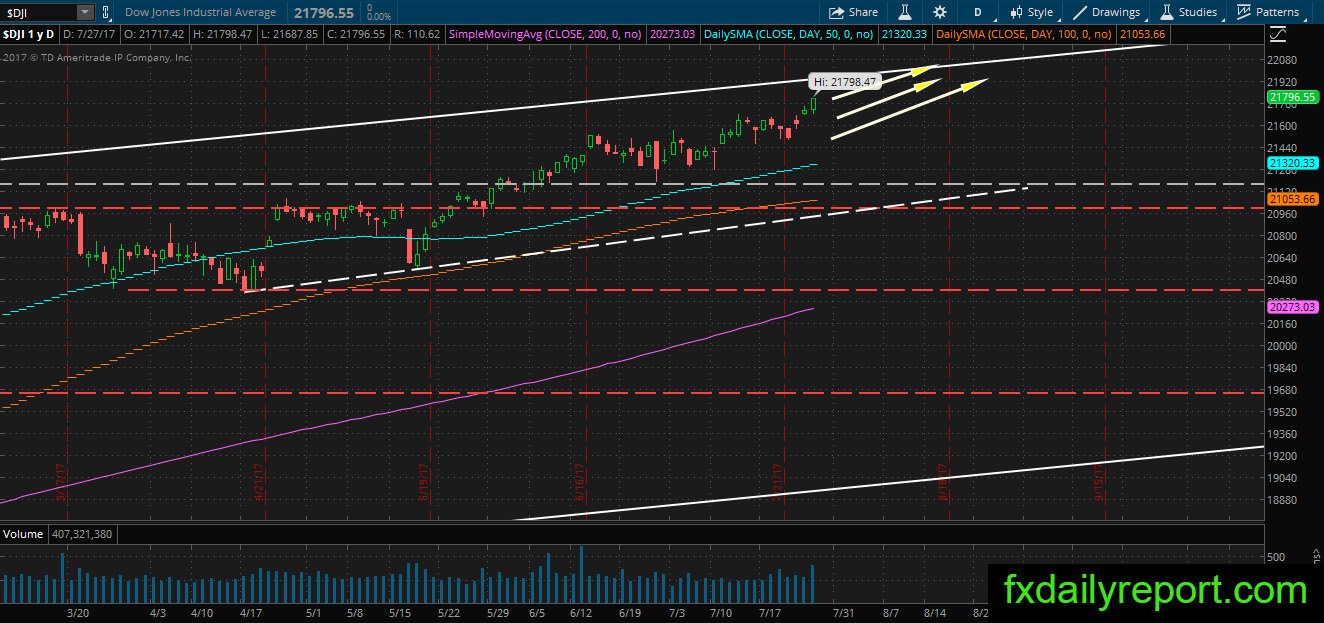
DJIA outperforming performance in the previous trading session might put to halt today as major name AMZN set to pull the market lower. The index is getting near 22,000, and it might reach the level in next week trading session. There is not much to analyze at the current point, and 21,670 – 21,700 will act as a support level.
Illnois Tool Works Inc (ITW)
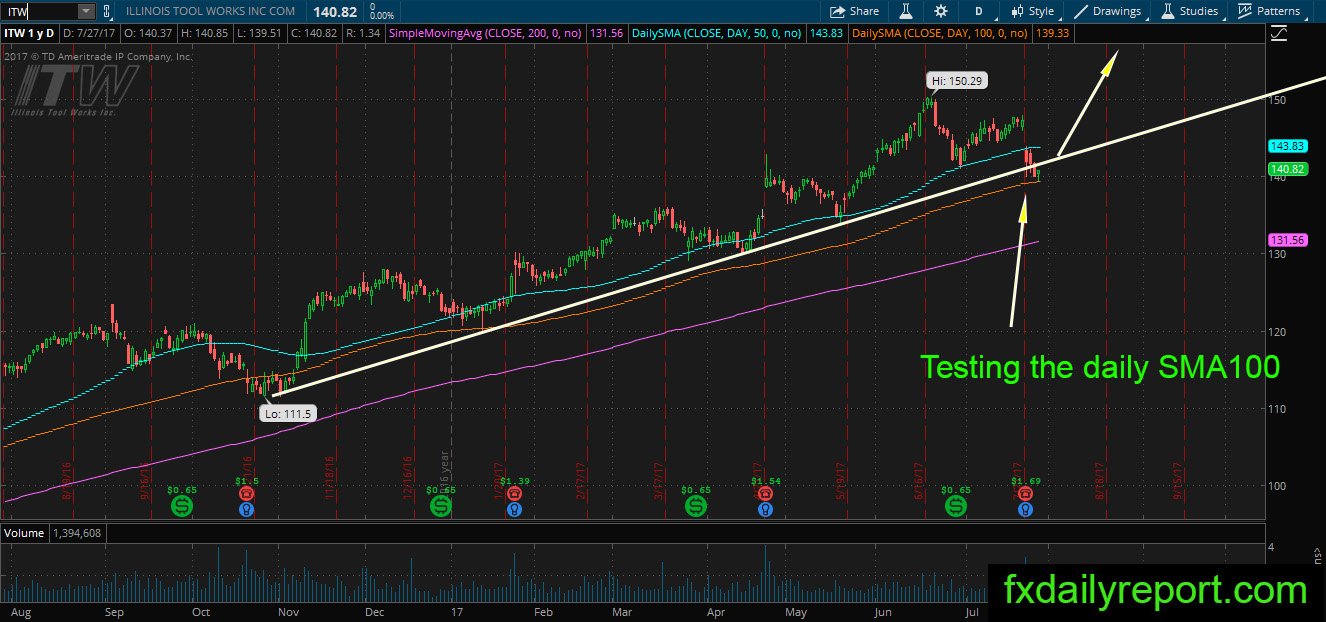
ITW back near its daily SMA 100 also the bullish trend line. Although it is bullish, traders might put emphasize on lower low creation (Previous higher low printed when the shares bounce from daily SMA 50). Currently, the long position could be taken with a stop below the daily SMA 100.
Lowe’s (LOW)

LOW come back above the daily SMA 200 is a good sign. The price most of the time will continue moving higher. At the current time, the price needs to maintain its position above the averages for several days to avoid downward continuation.
Other watch lists
IBM – Possible bullish pin bar formation, might lead IBM to upward correction.
EBAY – Bearish engulfing pattern after the earnings report, might continue lower.
TM – The price is approaching its daily SMA 200 from below. Look for bounce lower.
MO – Sharp bullish reversal when the price almost hit daily SMA 200, should continue higher.
Naturally, as Nasdaq pull-back, traders could find most of the tech stock form a bearish engulfing pattern. If the index continues lower, most of the bearish engulfing pattern could be traded safely. It might have high risk though and the best time to short might be when we are near the end of earnings season.