
Stock market under retreat on trade policy
The announcement of $50 billion in tariffs against China by President Trump put a huge weight on the market. Fear is spreading across the market on imminent trade wars. If the U.S proceed with the tariff plan, then China will retaliate with a counter tariff.
Stock market across the world is retreating while waiting for the actual announcement. Aside from the news, ECB has taken the step to end QE in December 2018. The policy drives Euro down across the board, and the loss deepens after the announcement of trade tariff.
Asian & European Stock market

Asian stock market closed mixed today. Nikkei closed up 113.14 points (+0.50%) to 22,851.75, Shang Hai Composite closed down 21.23 points (-0.70%) to 3,022.93 and Australia ASX 200 up 77.40 points (+1.29%) to 6,094.00. European stock market continue lower today. DAX Germany down 0.04%, FTSE UK down 0.64%, and Euro STOXX 600 down 0.23%.
Technical Analysis
Dow Jones Industrial Average (INDU)
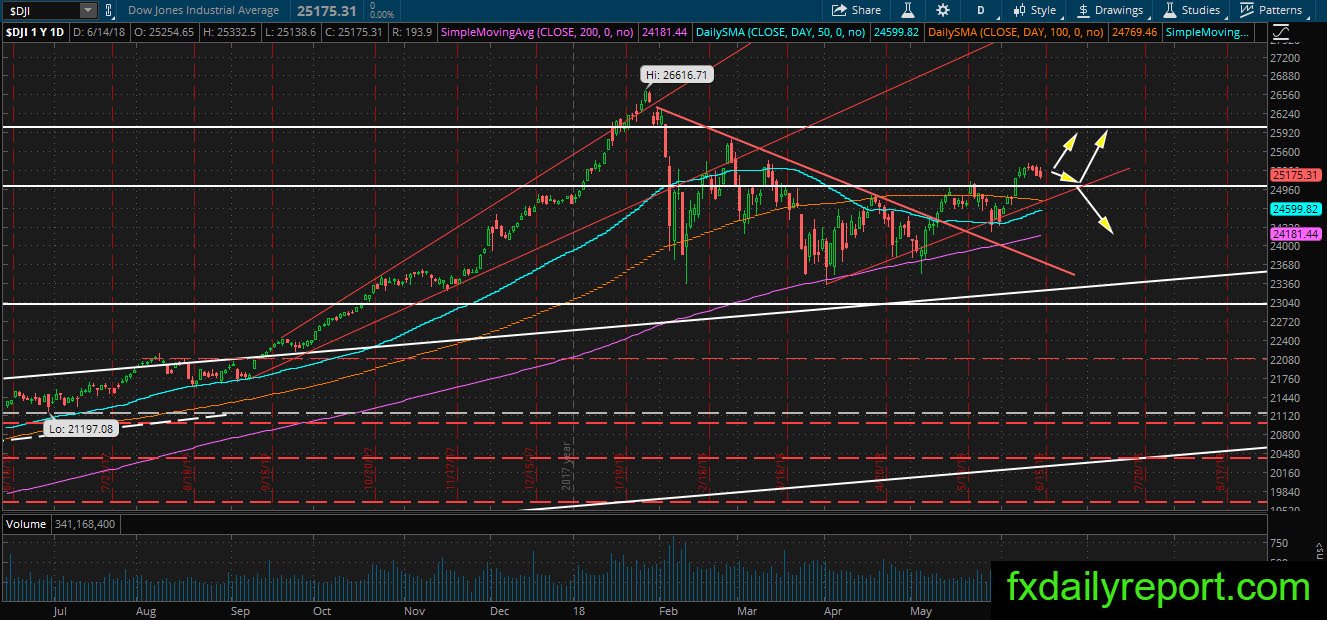
Dow Jones Industrial Averages continue the bearish streak this week and ready to close the week in negative as fear lingers in the market. The index futures down more than 150 points which indicate sharp lower opening. On the downward path, there is 25,000 support level. Will the index bounce from the support level or the red trendline?
Illinois Tools Works Inc (ITW)
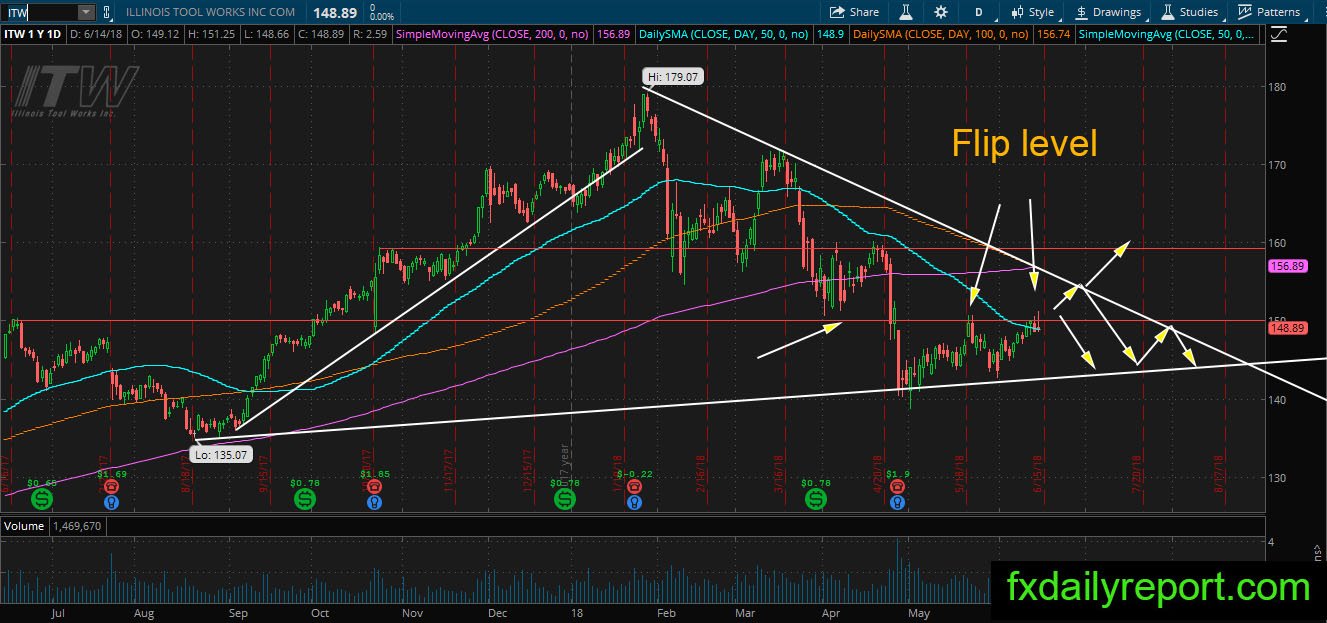
ITW stuck near the flip level and the daily SMA 50. The flip level is a strong resistance level and might reverse the share prices lower. However, if the level yield then ITW has a chance to test the upper trendline. Traders could prepare for a short position at the flip level or the trendline.
McDonalds Corp (MCD)
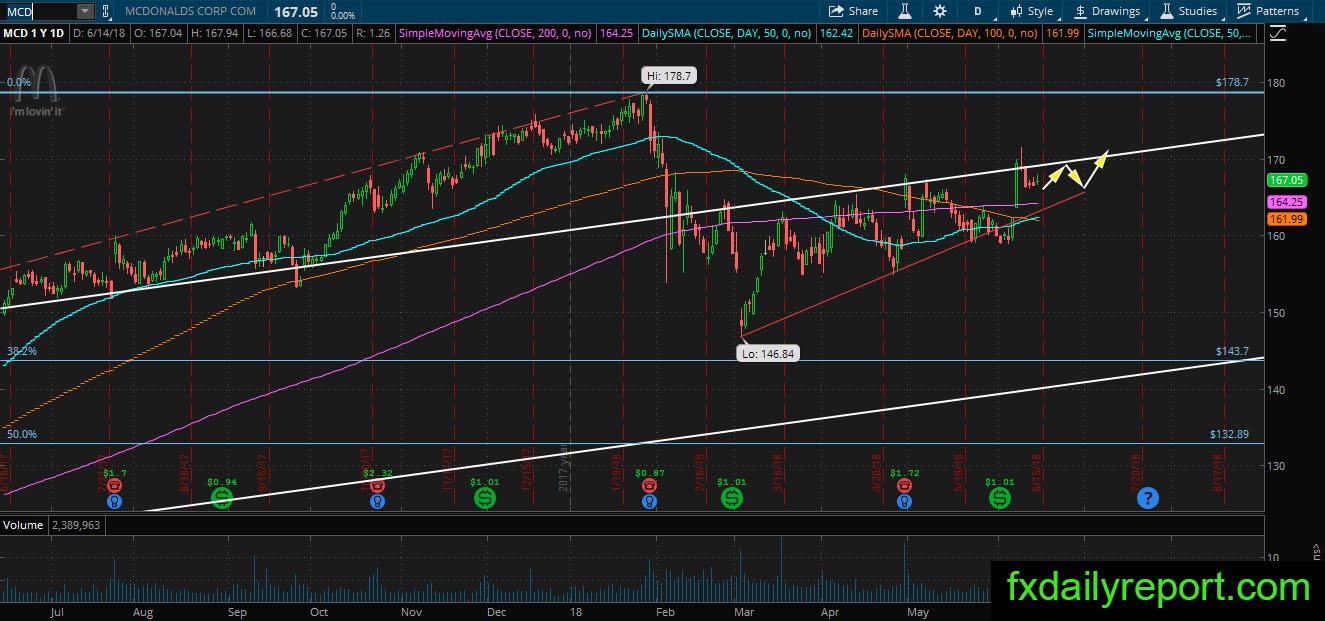
MCD direction is upward between the two trendlines. Recently, there is a bounce from the SMA 200 and lead the share prices up to test the white trendline. We might see MCD continue trading between both trendlines. It is better to look for long position when the share prices hit red trendline or daily SMA 200.