
Flat market before the end of week
There is no news to watch today except for New home sales and FOMC Member Powell Speaks. The market might continue under pressure today as crude oil headline influence the market. Although it is bearish, the Dow Jones Industrial Averages futures show a gain of 10 points.
The gain in the biotechnology sector and health sector should support the stock market from downside while energy sector retreats further. The market is waiting for healthcare draft which will ease the cost of Medicaid.
Other market

Initially, lead weakened by China in today trading session, the stock market in Asia recovered and closed on the positive side. Nikkei, Shang Hai Composite, and Australia ASX 200 gained 0.11%, 0.32%, and 0.17% respectively. The bounce might continue next week as China Shang Hai Composite initially fell more than 40 points and closed up 9.98 points at the end of the day.
European stock market on the other side moves down in agreement following worries about oil downside pressure. U.S dollar pulled back in the Asian and European trading session, but the look will reverse the losses proceeding to U.S trading session.
Technical Analysis
Dow Jones Industrial Averages (INDU)
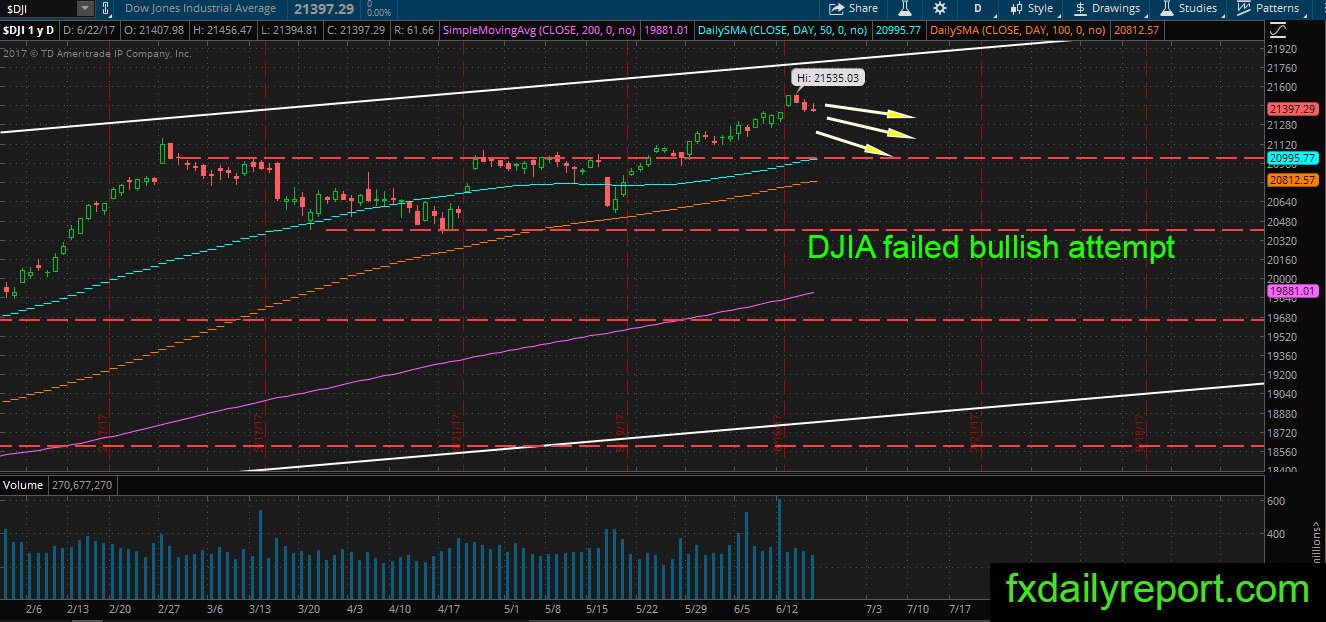
The advance of DJIA in the previous day hit an obstacle which pushes the price down and leads the index to close lower. The index move inside 70 points ranges and expected to continue its tight range movement today.
Dunkin Brands Group (DNKN)

DNKN found support once again at the bottom of the channel near the daily SMA 200. It is a text book trade, and there is strong bullish reaction near the bottom of the channel. Traders could expect the price will continue moving higher today targeting the top of the channel.
Kraft Heinz (KHC)
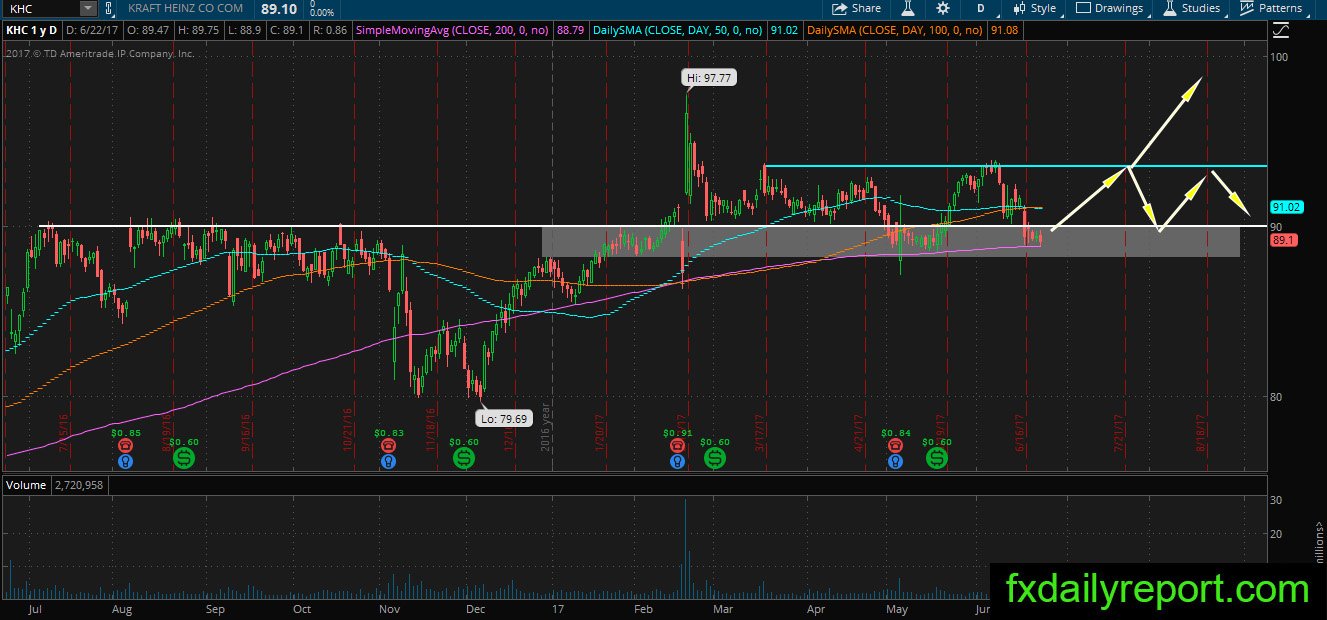
The share price of KHC is floating near the daily SMA 200 and support area between $88 – $90. There is no clear evidence yet for a bullish bounce from the support area. Traders could look for a long position with a stop below $88 or wait until bullish candlestick formed from the support level and close above $90.
Other watchlist
MON – possible bounce from the daily SMA 50