
Stock extend previous day decline
Negative sentiment painted the market red today. There is no sign of bull for risk-on sector in Asia and European stock market. Traders and investors paying close attention to renewed fear on trade wars. We are taking the table from MarketWatch for the current situation on trade wars. Here is the table below:
| Imposer | Target | Subject | Rate | Imposed or threatened |
| U.S. | China, South Korea and Mexico | Washing machines | 20%-50% | Imposed |
| U.S. | Most countries, notably China | Solar panels | 30% | Imposed |
| U.S. | Canada | Newsprint | 22% | Imposed |
| U.S. | European Union, Canada, Mexico and most other countries | Steel | 25% | Imposed |
| U.S. | European Union, Canada, Mexico and most other countries | Aluminum | 10% | Imposed |
| European Union | U.S. | Bourbon, orange juice, jeans and other products | 25% | Imposed |
| Mexico | U.S. | $3 billion of U.S. goods including steel and pork | 20%-25% | Imposed |
| Canada | U.S. | $12.8 billion of U.S. goods including maple syrup and whiskey | 10-25% | To take effect July 1 |
| India | U.S. | $241 million of apples, stainless steel and other products. | 7.5%-60% | To take effect Aug. 4 |
| U.S. | China | $50 billion of goods | 25% | To take effect July 6 on $34 billion worth. Second set of $16 billion pending further review. |
| China | U.S. | $34 billion of U.S. goods | 25% | To take effect July 6 |
| U.S. | China | Additional $200 billion of goods | 10% | Threatened |
| U.S. | European Union | Automobiles | 20% | Threatened |
Similar to the previous day, there is nothing to do except to stay bearish as long as trade war fears making headline across the global market.
Asian & European Stock market

Asian stock market moves lower on trade fear. Nikkei closed down 1.38 points (-0.01%) to 22,270.39, Shang Hai Composite closed down 27.20 points (-0.97%) to 2,785.98 and Australia ASX 200 up 19.50 points (+0.31%) to 6,215.40. European stock market also dip. DAX Germany down 1.67%, FTSE UK down 0.39%, and Euro STOXX 600 down 1.07%.
Technical Analysis
Dow Jones Industrial Average (INDU)
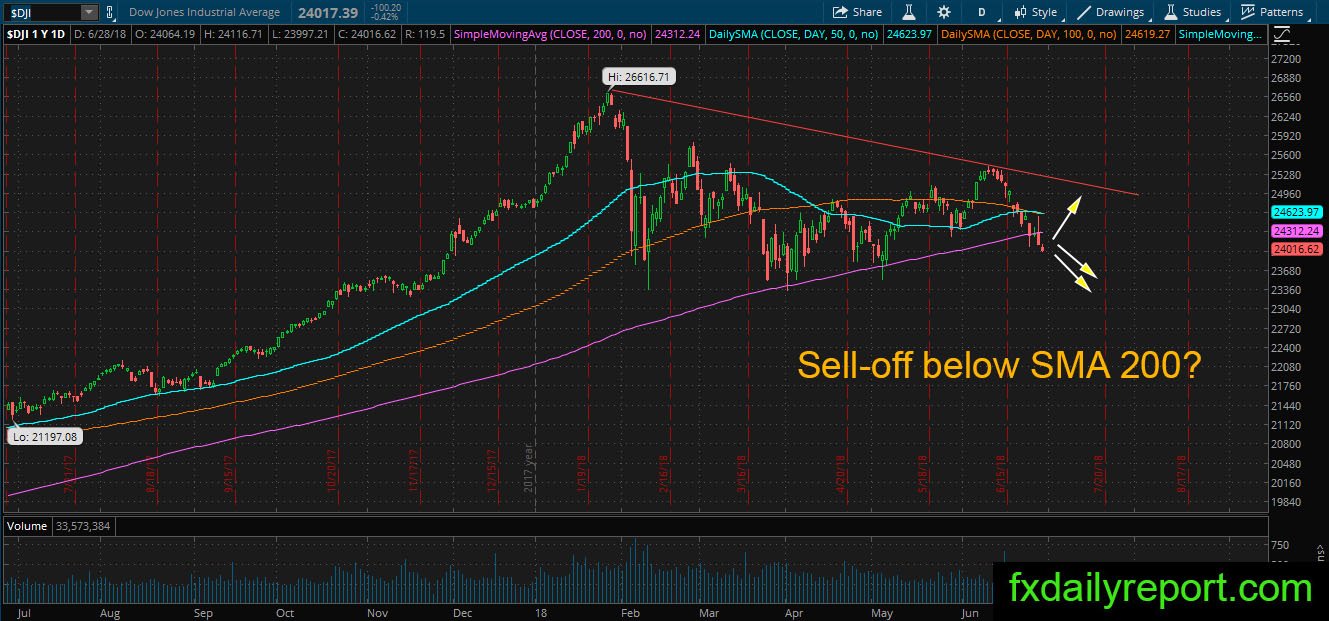
DJIA might have lost it now after weak opening today. The index follows through the bearish close below SMA 200 in the previous day and widens the distance. Currently, the index traded down 84 points and ready to close below previous day low.
Without any change in the sentiment, we might see DJIA test this year low.
Nike Inc (NKE)
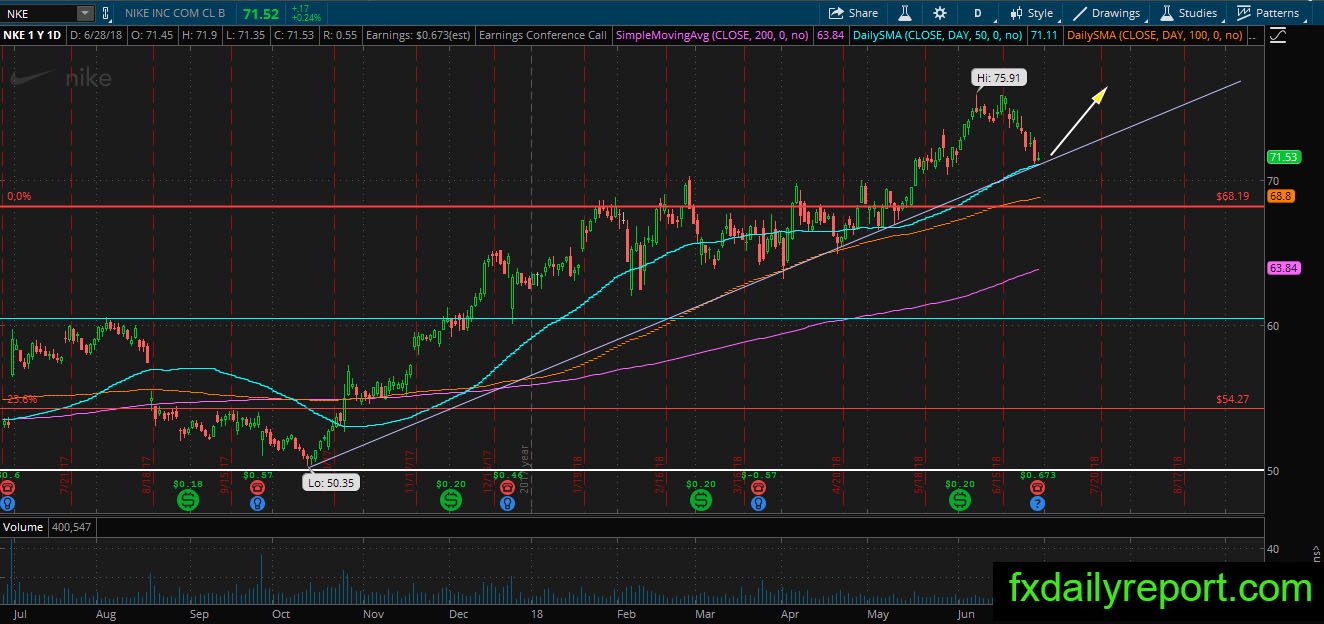
NKE share prices correction reached daily SMA 50 and the up trendline. There is no reaction yet from the trendline test and the bull maintaining the price above it. Traders will wait for either breakout below the trendline or bounce before placing any position.