
U.S stock market cautious ahead G7 meeting
The leaders of G7, U.S, and allies scheduled to meet in Canada for two days meeting. Previously President Trump imposed tariffs on aluminum and steel imported into the U.S which flare up trade tensions. Traders and investors prepared for heated debates on the tariff, especially after Canada and France’s officials tweeting to Trump about their disagreement over tariff.
After the G7 meeting, President Trump will head to Singapore for U.S-North Korea summit on June 12. Depend on the meeting, G7 and U.S-North Korea summit will set the tone of global market sentiment.
Asian & European Stock market

Asian stock market closed mostly lower today. Nikkei closed down 128.76 points (-0.56%) to 22,694.50, Shang Hai Composite closed down 42.37 points (-1.36%) to 3,067.13 and Australia ASX 200 down 12.10 points (-0.20%) to 6,045.20. European stock market also under pressure. DAX Germany down 0.16%, FTSE UK up 0.06%, and Euro STOXX 600 down 0.03%.
Technical Analysis
Dow Jones Industrial Average (INDU)

The index surpassed 25,000 marks this week, but it looks like the bear return at the end of the week and ready to push the index back below 25,000. Currently, Dow futures skid 86 points and indicate weak open. The nearest support level is 25,000 and the red trendline. Expect a close near 25,000 by the end of the week.
Air Product (APD)
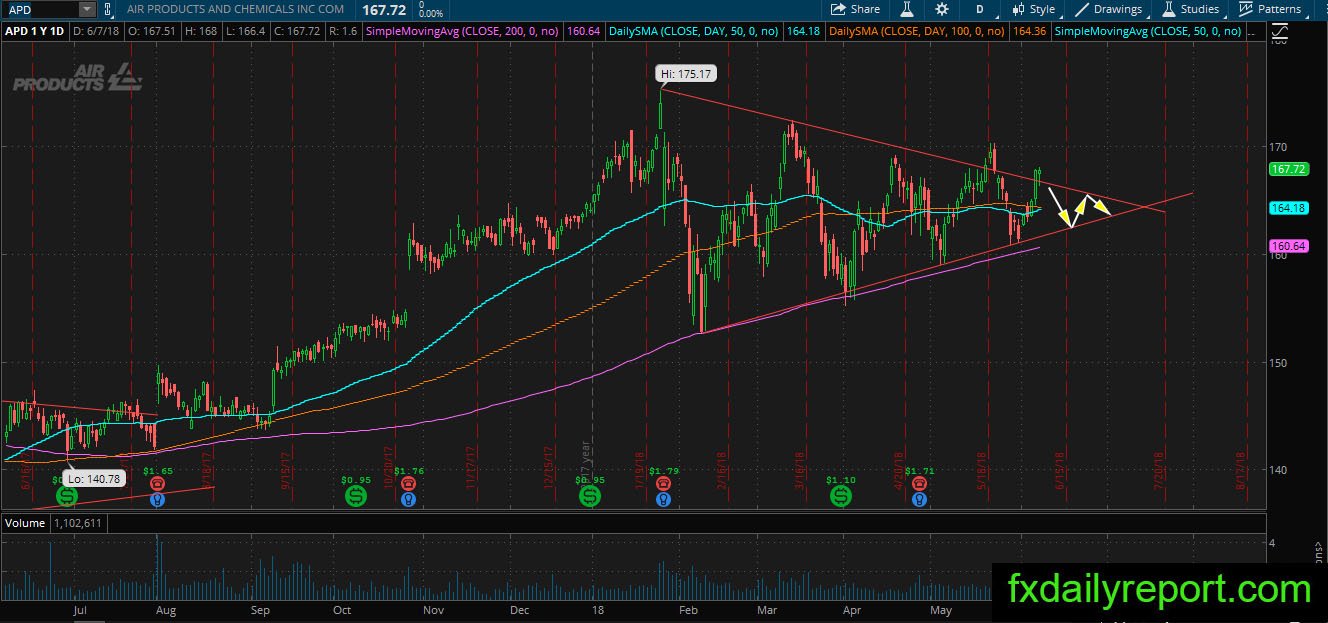
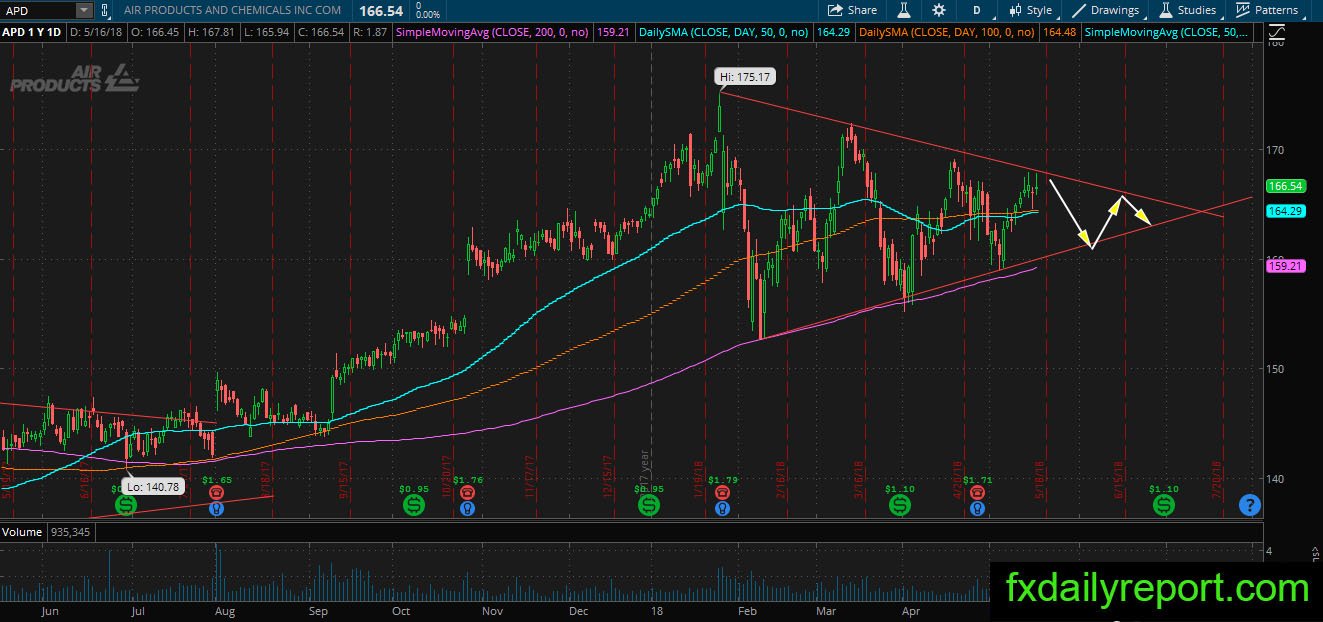
APD come under watch again after the share prices rejected from top of the triangle and bounced from the bottom of the triangle. The share prices currently traded at the top triangle, will it repeat the rejection and make another test at the bottom of the triangle?
EBAY Inc (EBAY)

EBAY launched from the white trendline and daily SMA 200. The upward momentum brings the share prices to close previous earning gap. There is a confluence of strong levels such as SMA 100 and downtrend line which will hinder the bull from pushing the price further upside.
If the share prices move down, traders could look for long position near the white trendline and daily SMA 200.