
Stocks Slide as Oil Surge Fuels Market Concerns
U.S. equities declined sharply during the latest trading session as rising geopolitical tensions pushed oil prices higher and weighed on investor sentiment. Concerns intensified after Iran signaled that it could keep the Strait of Hormuz closed, raising fears of disruptions to global oil supply.
The Dow Jones Industrial Average led the decline, falling 619.37 points (-1.31%) to close at 46,797.90. The S&P 500 dropped 84.90 points (-1.25%) to 6,690.90, while the Nasdaq Composite lost 343.41 points (-1.51%) to finish at 22,372.73.

The sharp move lower highlights growing risk aversion across financial markets as traders react to the potential economic impact of rising energy prices and escalating geopolitical tensions.
Dow Jones Industrial Average (INDU)
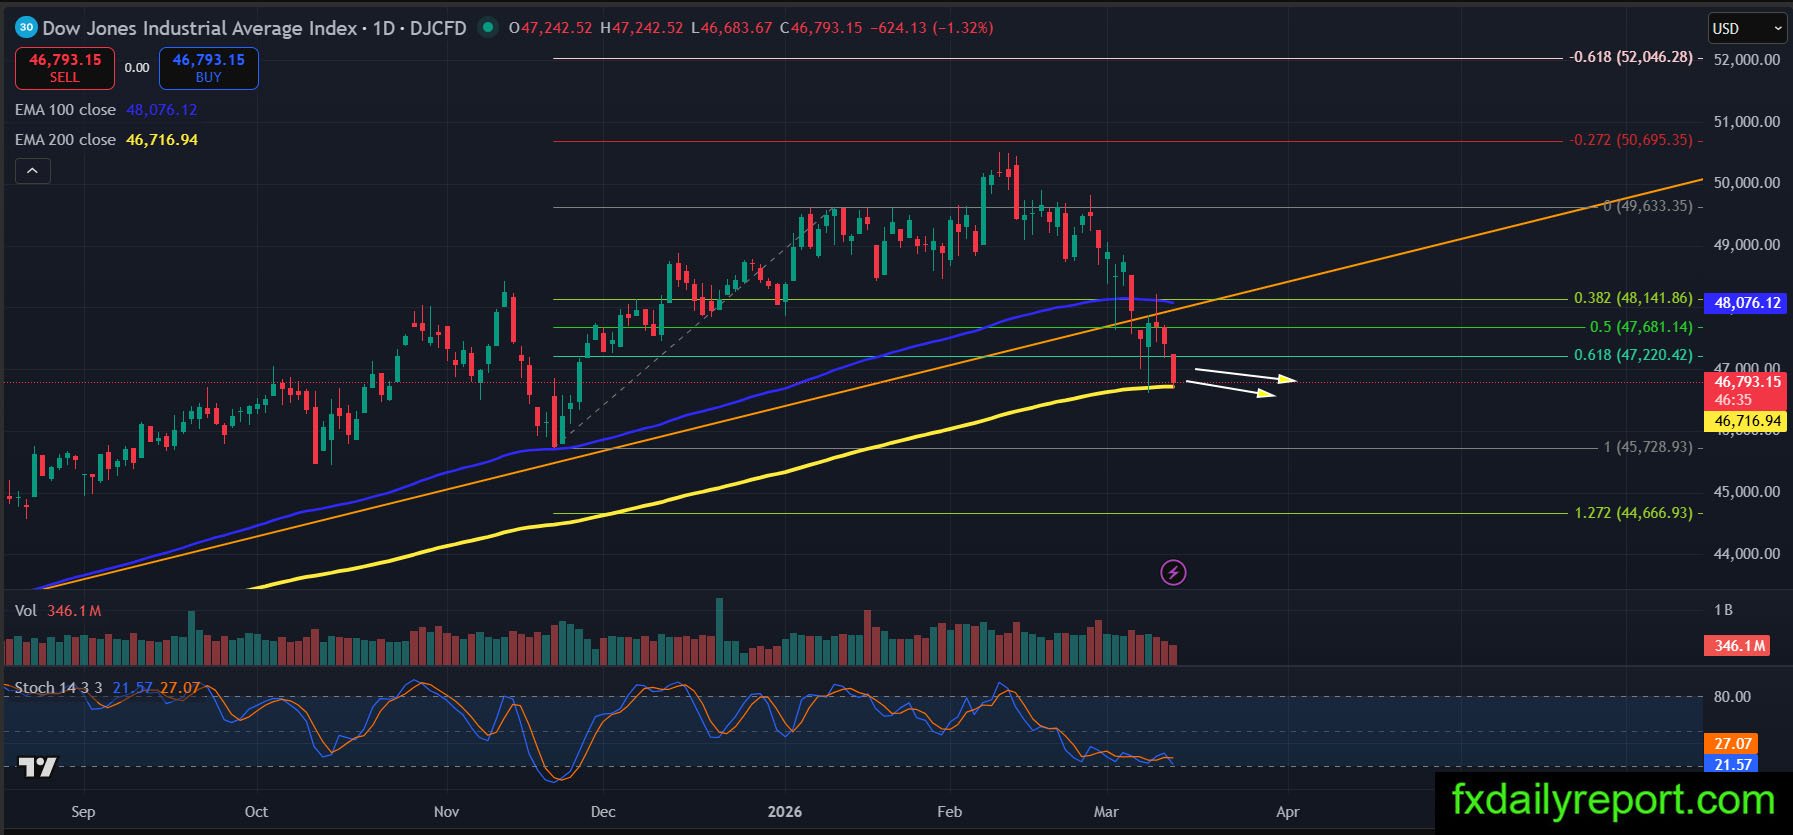
The Dow Jones Industrial Average remains under bearish pressure after breaking below the previous support area and moving closer to the daily EMA 200. The recent decline suggests that the bear are currently in control, increasing the risk of a continuation toward lower levels. The index is now testing the EMA 200 support zone, which may act as an important technical level in the near term. Traders will likely monitor how the index reacts around this level, as it could determine whether the market stabilizes or continues moving lower.
Rivian Automotive Inc. (RIVN)
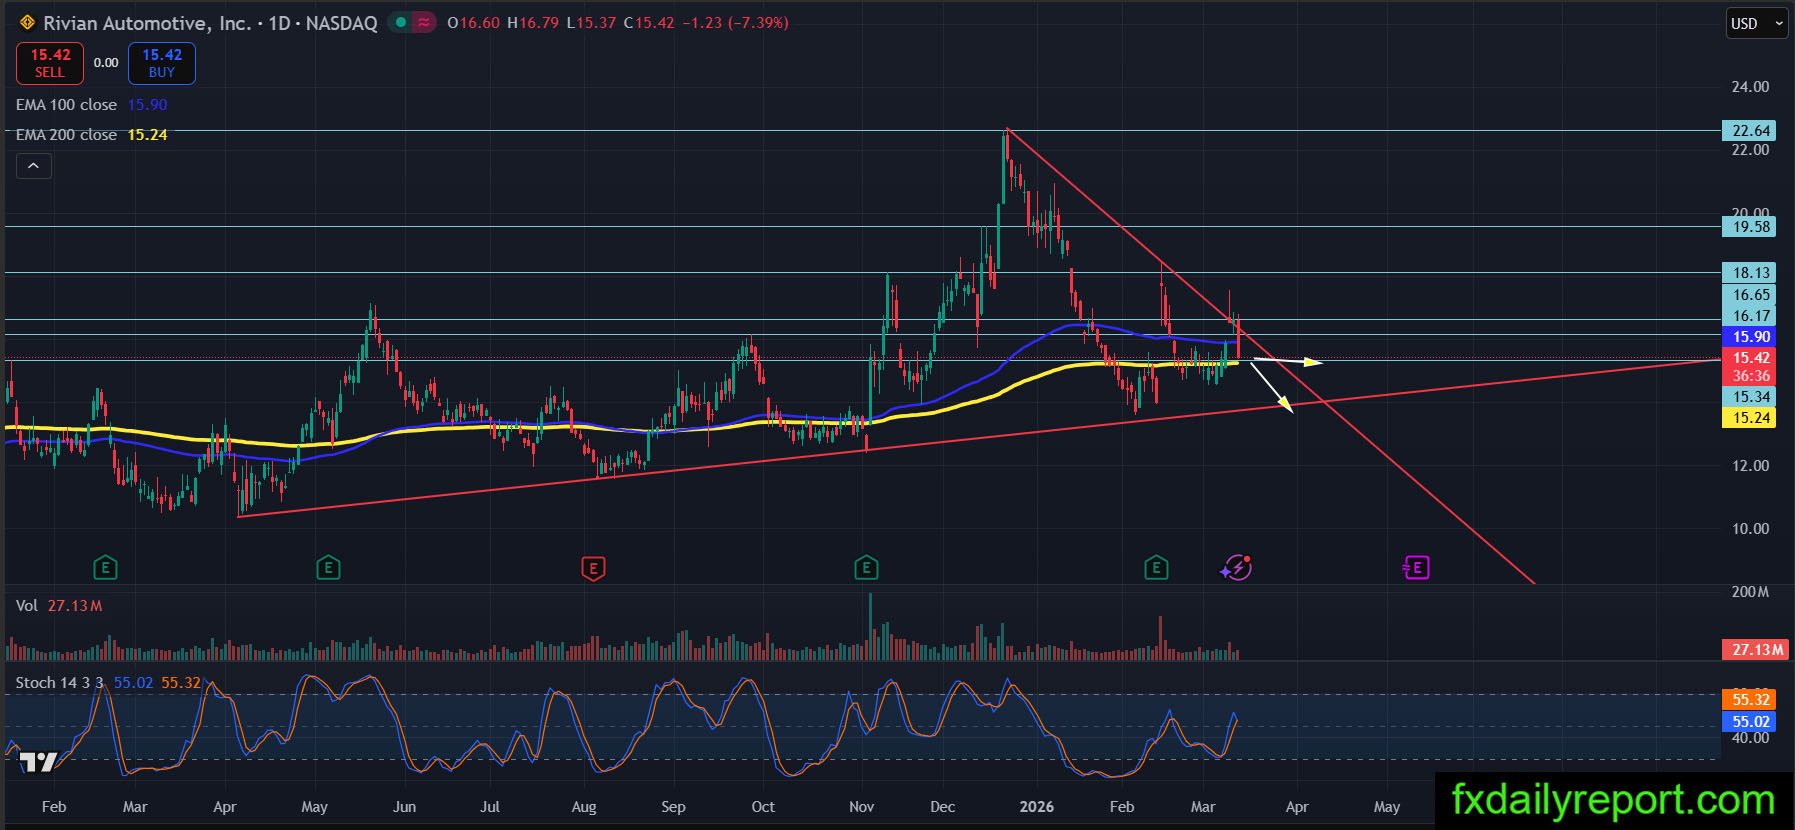
Rivian appears to be trading inside a triangle consolidation pattern as the price action gradually narrows between support and resistance lines. The stock is currently hovering around the EMA 200 area, which may act as a key level for the next directional move. As long as the price remains inside the triangle structure, the market may continue consolidating while building momentum for a breakout.
We favor bullish breakout and continuation upward, traders could use the bottom of triangle and the EMA 200 as place to accumulate long positions. When there is new lower swing low printed then it is signal that the trend will continue bearish.