
Market prepares for The Fed rate-hike
The global stock market is in a mixed situation as investors and traders look to The Fed interest-rate decision today. The expectation is an increase of 25 bps from 1.50% to 1.75%. What the market is waiting for is the commentary for future policy. A hawkish comment should put the stock market under pressure.
Another news to watch is further trade tariff and measures against China which President Trump will propose on Thursday. The tariff could amount to $30 billion and gradually imposed. From China side, the country might retaliate by targetting soybeans import from the U.S.
Asian & European Stock market

Asian stock market closed mixed after the cautious trade. Nikkei closed on Vernal Equinox Day holiday, Shang Hai Composite down 9.05 points (-0.27%) to 3,281.59 and Australia ASX 200 up 13.90 points (+0.23%) to 5,950.30. European stock market slightly lower. DAX Germany down 0.01%, FTSE UK down 0.53%, and Euro STOXX 600 down 0.14%.
Technical Analysis
Dow Jones Industrial Average (INDU)
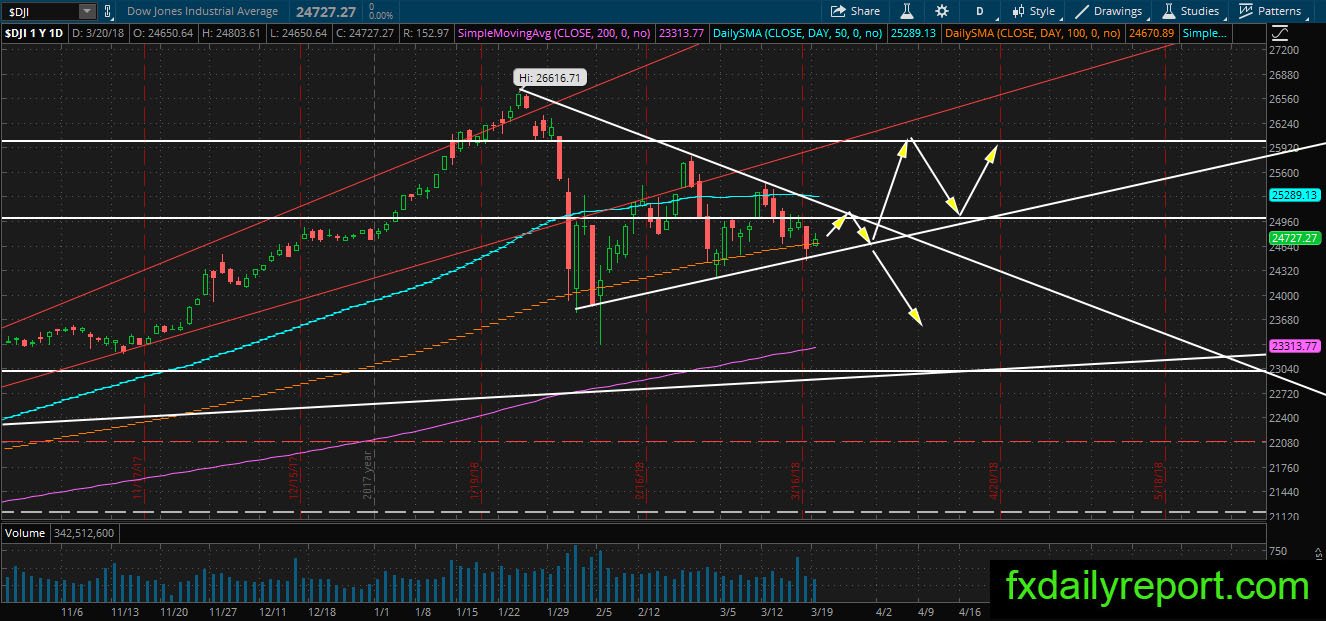
DJIA closed above the daily SMA 100 but without strong margin and suggest the sideways movement inside triangle pattern will continue. Will the index continue holding above the averages and start bounce from it?
Activision Blizzard Inc (ATVI)
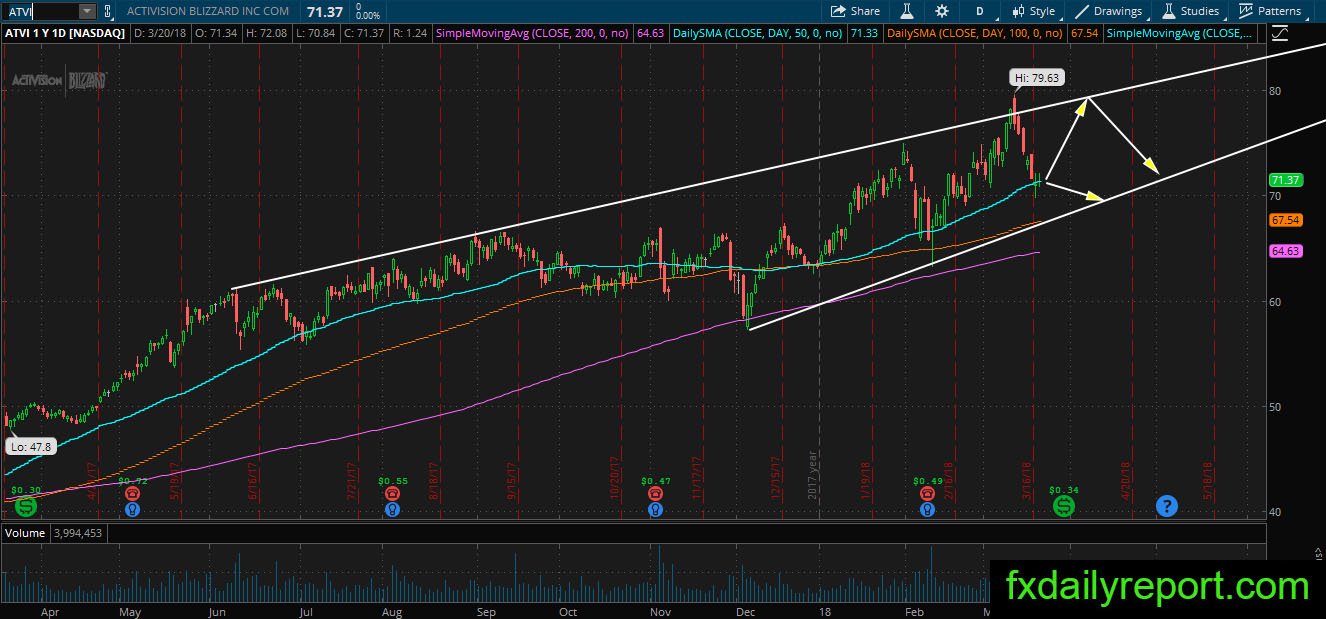
ATVI bullish trend continues after the share prices bounced from the daily SMA 200. Currently, the share prices are testing the daily SMA 50. Traders could look for a long position or wait until ATVI drifted lower to the daily SMA 100 where there is trendline present.
Caterpillar Inc (CAT)
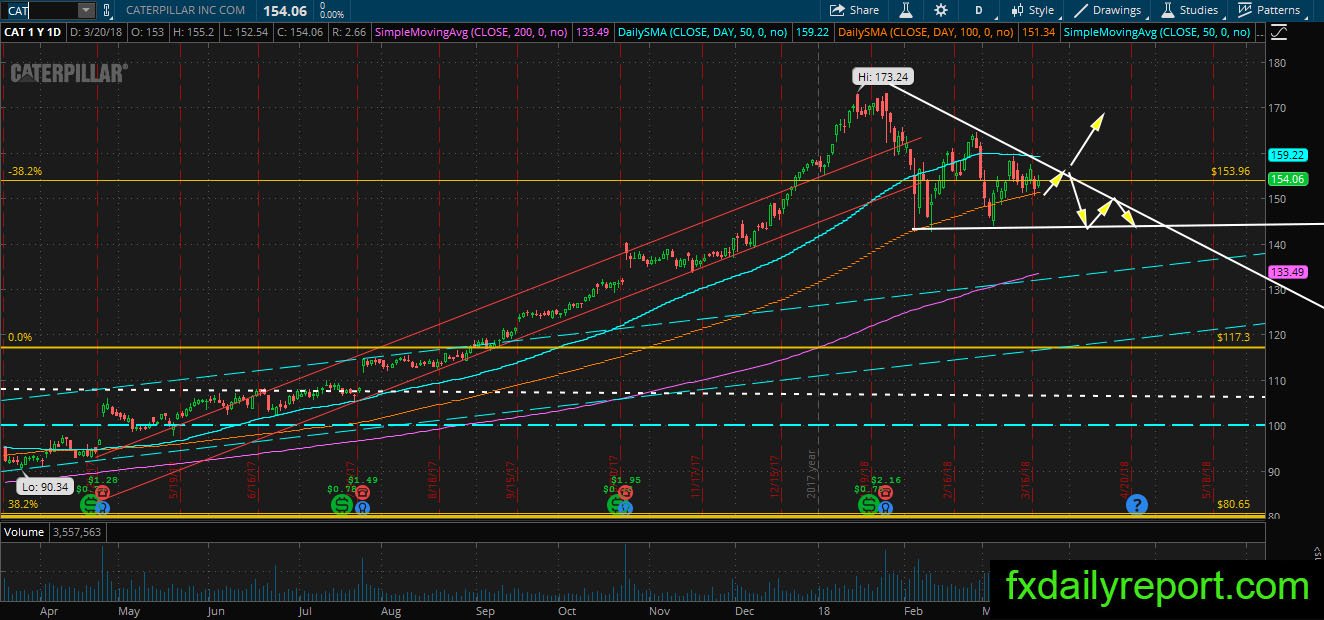
CAT supported by its daily SMA 100 but looks like it is moving inside the triangle pattern shown on the daily chart. It is possible for the bull to come in near the SMA 100, but it is also possible for the share prices to move toward the bottom of the triangle before bounce happens. Traders could look for a long position at either level.
Other Watchlists
ABC – The share prices slide hard toward its daily SMA 200. If the downward pressure continues, it might break below the averages. Look for the long opportunity when there is a bullish reaction. On the other hand, a short position also suggested after the breakout and retest of SMA 200 happen.