
Growth worry shadowing the market
Weak data from Europe pull the market down. Dow Jones Industrial Averages future down 104 points before the market open. In the previous day, U.S stock market also started the day on the weak side as The Fed projected slower growth rate this year. Today weak data is another confirmation that the global economy experiencing slowdown and should sound alarmed.
Currently, U.S dollar index moving up 0.33% to 96.67 and might close the week on the positive side after initially suffering losses when The Fed outline dovish outlook.
Asian & European Stock market

Asian stock market added gain at the weekly close. Japan stock market up 18.42 points (+0.09%) to 21,627.34, China Shanghai Composite up 2.69 points (+0.09%) to 3,104.15, and Australia ASX 200 up 28.00 points (+0.45%) to 6,195.20. European stock market drop on weak growth. DAX Germany down 0.49%, UK FTSE down 0.99%, Euro STOXX600 down 0.49%.
Technical Analysis
Dow Jones Industrial Average (INDU)
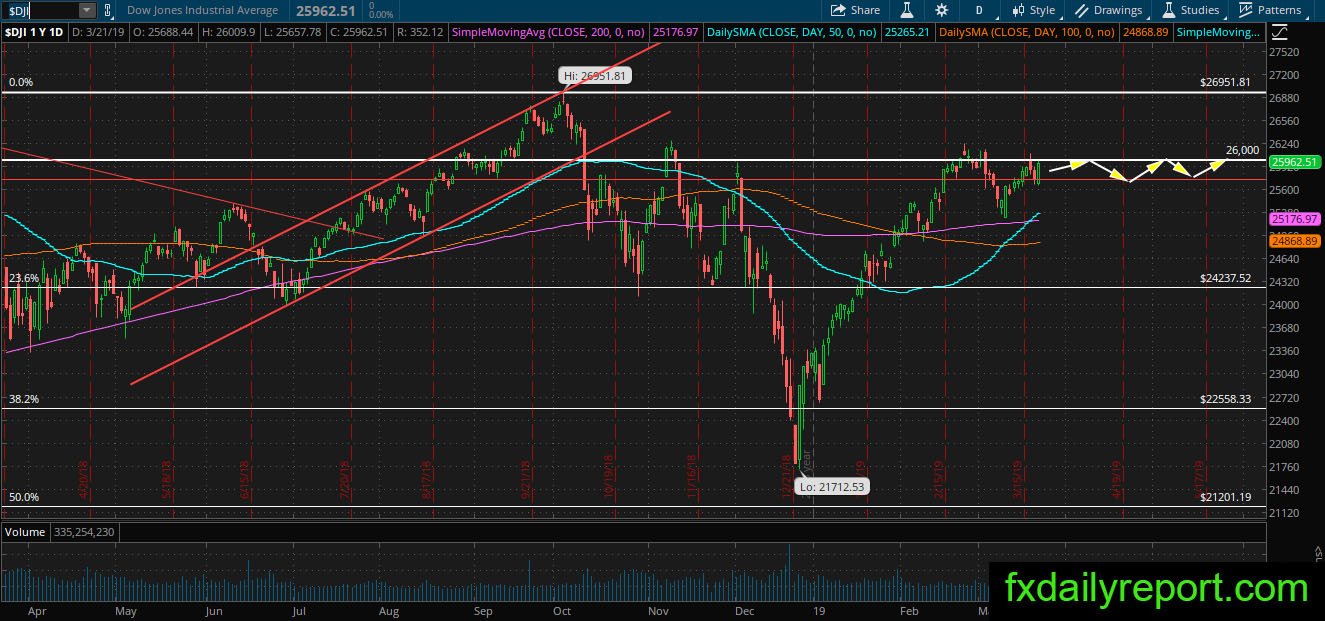
DJIA has not moved away from 26,000 and continue the sideways movement between 25,800 – 26,000. Not much expectation the index will make a major movement as today is the last trading day of the week. We might see the index settle between 25,800 – 26,000.
Las Vegas Sands (LVS)
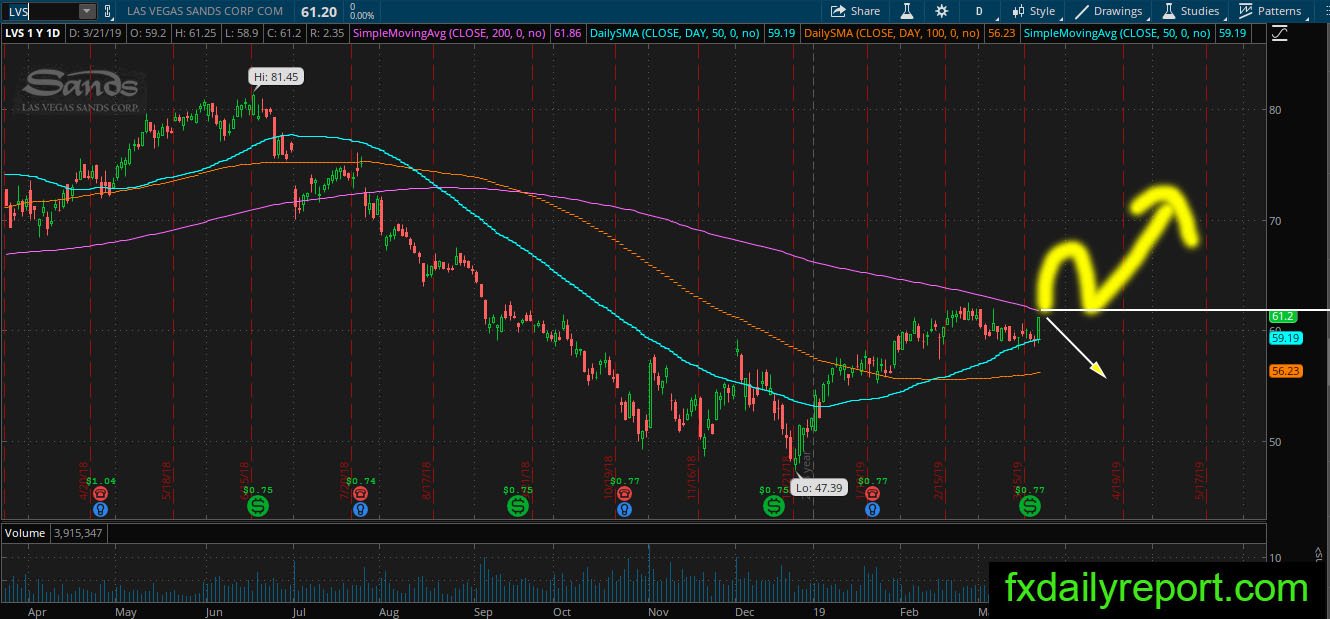
LVS trend is bearish and it is safer to take short positions near resistances. The share prices currently traded near the daily SMA 200. It could punch through the resistance and make retest before continuing further upside. But, traders must wait for the price reaction. If a strong bearish pattern emerges after the test then traders could place short positions.
Western Union Company (WU)
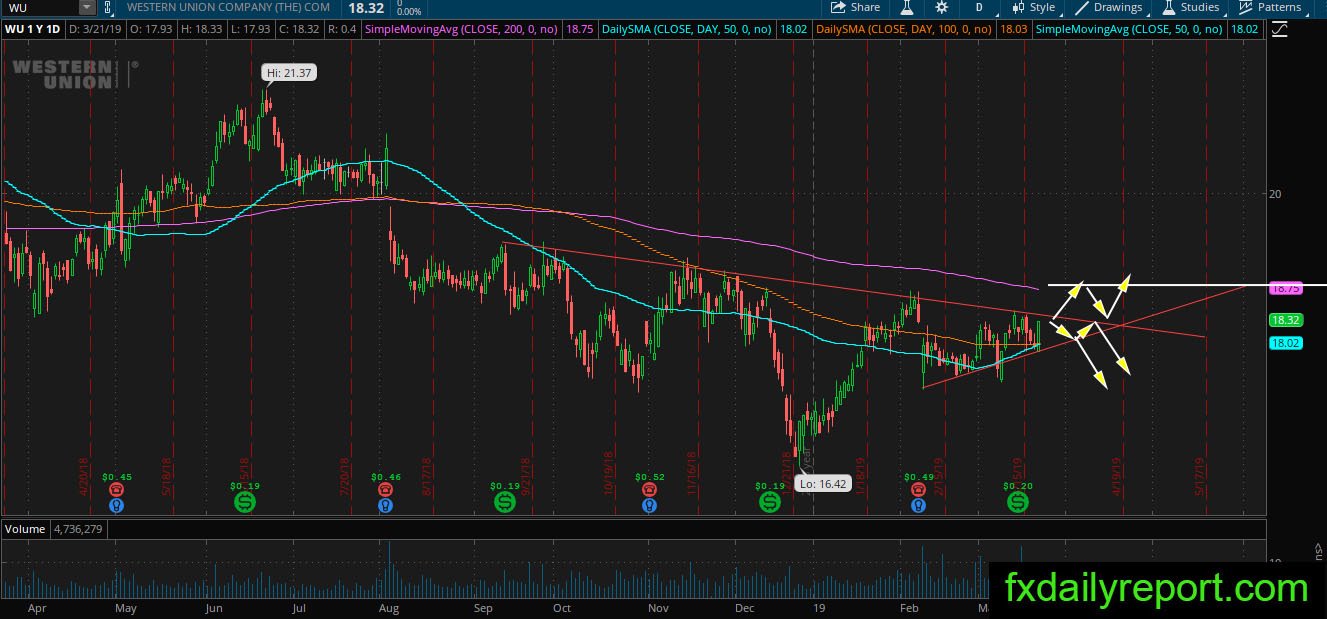
WU traded inside a triangle pattern on the daily chart. There is strong bullish momentum yesterday which might push the share prices up above the top of the triangle. However, on the upside, there is SMA 200 resistance. The overall situation still favors short positions than long positions.
Short positions could be taken at the top of the triangle or SMA 200. On the other hand, long positions could be taken at the bottom of the triangle. Another long positions option is when a break above SMA 200 followed by a retest of the averages.