
Stock market higher as fear recede
Previously, the fear of slowdown on the U.S economy brought the market down. Analysts see inverted yield rate as an early sign of recession. But, it is too early to conclude the event will happen as The Fed might settle to rate-cut to prevent the recession scenario.
A special report by Robert Mueller cleared the doubt over collusion with Russia. The report finds no evidence that the President has been colluding with Russia to win the 2016 election.

On the economic ground, the market will observe a consumer confidence report. Forecast see a number of 132.1.
Asian & European Stock market
Asian stock market mostly higher. Japan stock market up 451.28 points (+2.15%) to 21,428.39, China Shanghai Composite down 45.94 points (-1.51%) to 2,997.10, and Australia ASX 200 up 4.40 points (+0.07%) to 6,130.60. European stock market advance today. DAX Germany up 0.12%, UK FTSE up 0.32%, Euro STOXX600 up 0.39%.
Technical Analysis
Dow Jones Industrial Average (INDU)
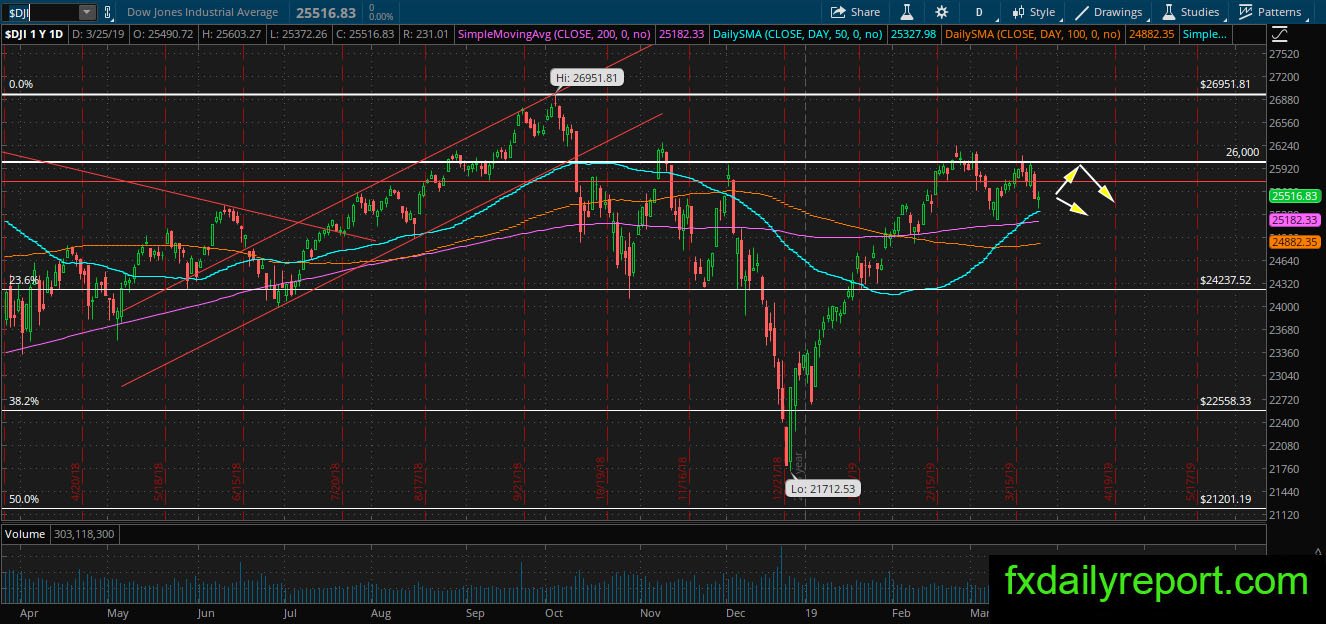
The index finally rejected from 26,000 handles and drifted lower. It tests the level near SMA 50 yesterday and shows a little bullish reaction. Today, before the market open, DJIA futures pointed upward more than 90 points which indicate bullish opening. Will DJIA maintain the bullish pressure until the end of the trading day and launch toward 26,000 again?
Apple Inc (AAPL)
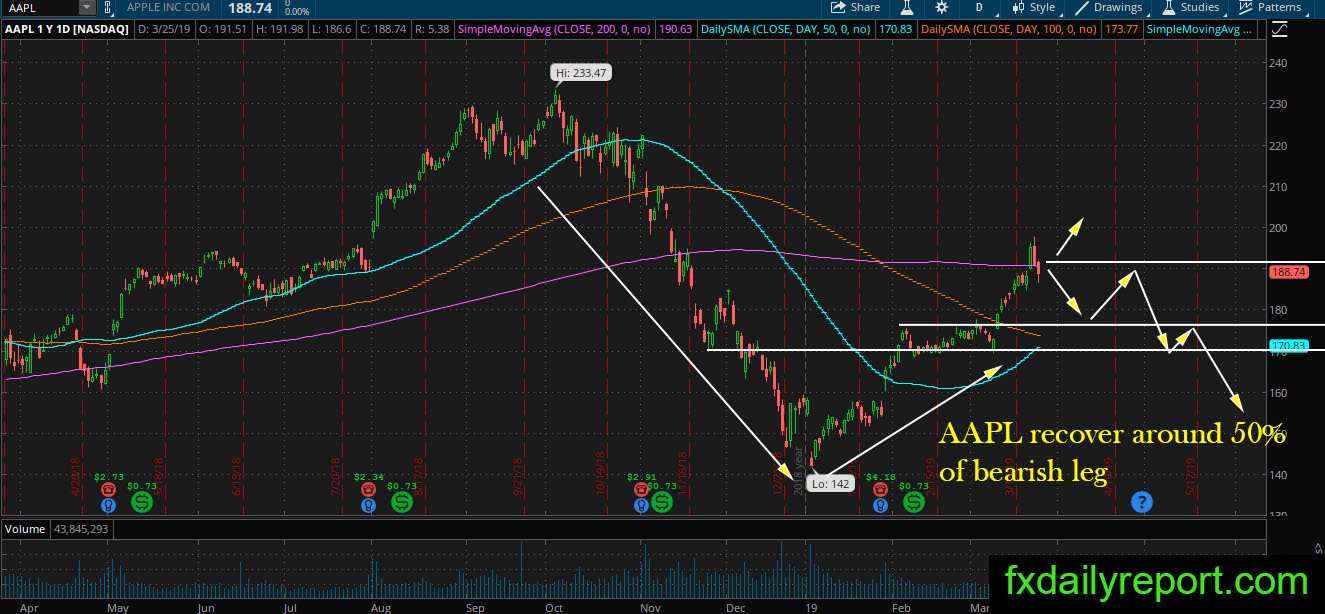
AAPL has recovered 50% of its losses incurred since the bearish movement from $233.47 to $142.00. Coincidentally, the 50% upward correction also hit the SMA 200 and formed a bearish pattern. It could be a profit taking action or bearish continuation. Under the current fundamental and technical situation. We could regard the current movement is a correction and favor bearish scenario.
Short positions from the SMA 200 is the suggested option traders could take. However, if a breakout and successful bullish bounce from SMA 200 when retest happens then traders should switch to the bullish scenario.
Boeing Co (BA)

The bearish trend incited since the major crash of Ethiopian airline caused Boeing share prices to tank heavily. It might be supported by the daily SMA 100 & 200 but we have a lower high printed on the chart. Usually, the retest of SMA will result in a bounce, but the current fundamental situation suggests breakout lower. Traders might want to avoid long positions at least until higher high printed on the chart.