
Bond yield, Brexit and lower growth to stir the market
The stock market in Asia fell on growth concern. The situation continues in Europe with the addition of Brexit vote by the MP. In the previous day, trade deficit data shrink more than expected. In January, the U.S recorded a trade deficit of $51.1 billion vs. $57.0 billion expectation. It is good news but might be temporary as U.S-China still undergo trade talk.
Today, the market will observe GDP data to get a clue on the slowdown issue. Worse than expected number could send the equity market tumbling.
Asian & European Stock market

Asian stock market mostly lower. Japan stock market down 344.97 points (-0.23%) to 21,033.76, China Shanghai Composite down 27.78 points (-0.92%) to 2,994.94, and Australia ASX 200 up 40.10 points (+0.65%) to 6,176.10. European stock market slightly higher htoday. DAX Germany up 0.14%, UK FTSE up 0.53%, Euro STOXX600 up 0.05%.
Technical Analysis
Dow Jones Industrial Average (INDU)
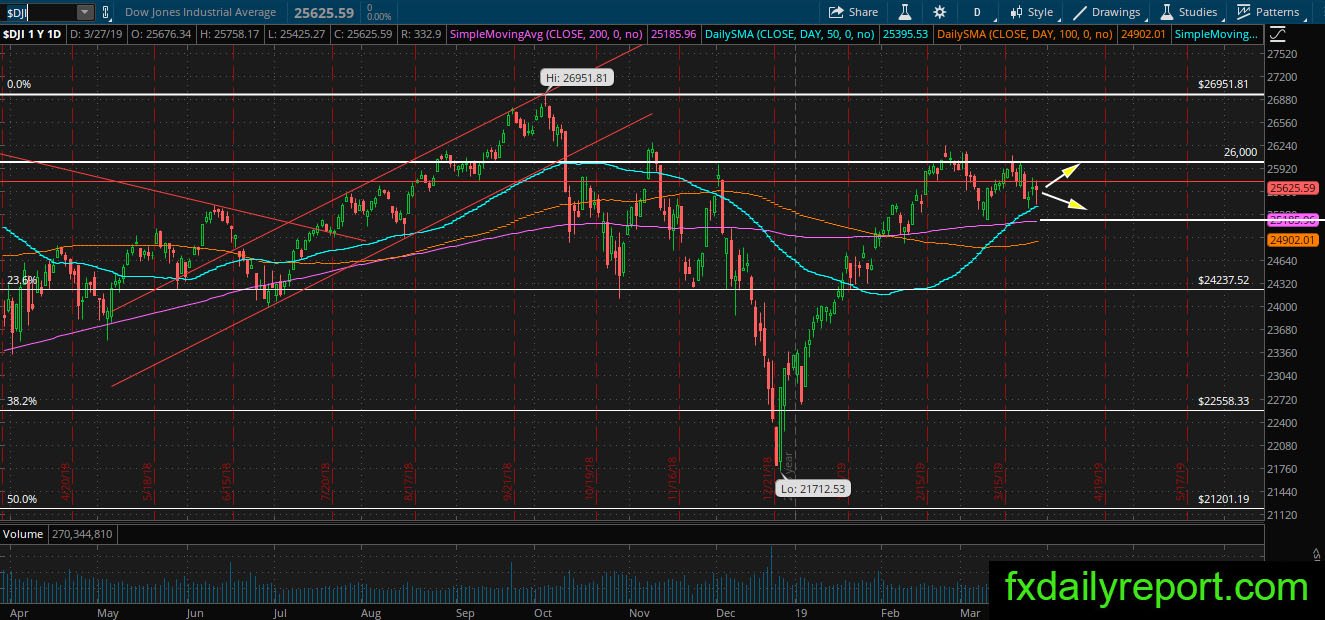
DJIA showing no major change yet to its current trend. The index traded between SMA 200 and 26,000 resistance at the current time. Traders will continue to wait for a breakout of the range to happen before deciding the next long-term trend.
Bed Bath & Beyond (BBBY)
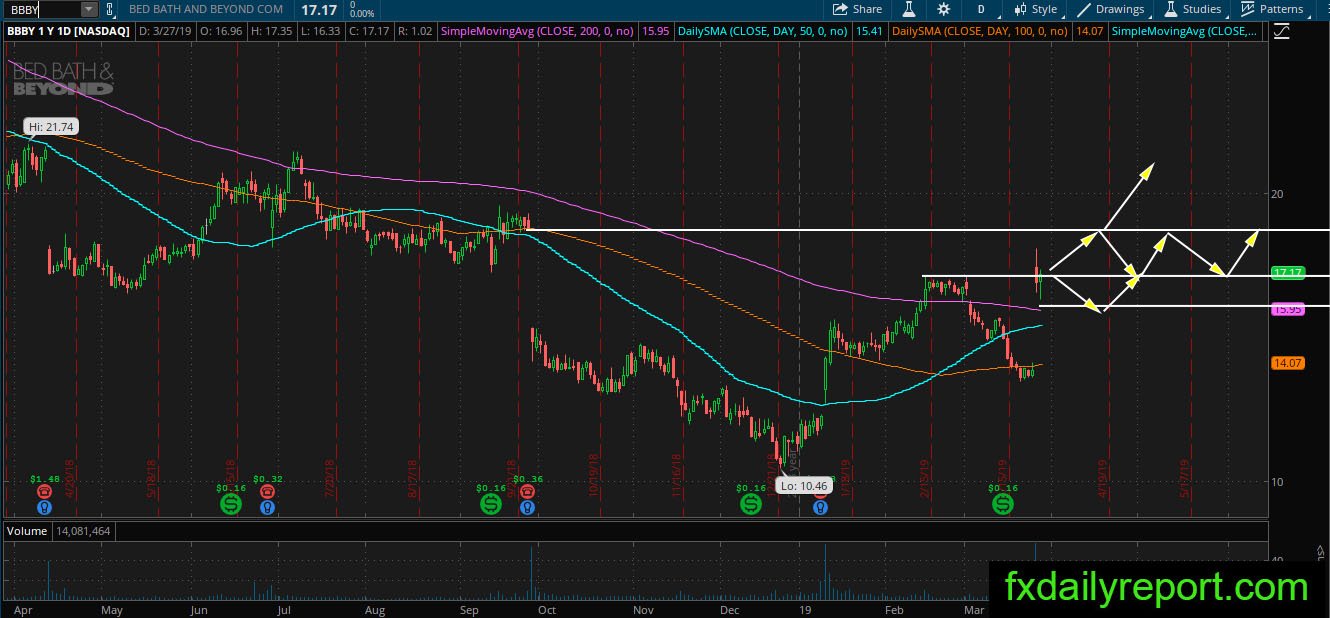
BBBY gapped up above the daily SMA 200 and maintain the level above it for the second day. The share prices might have to change the trend to bullish after the open above SMA 200. At the current time, it is possible the bear will push the share prices lower and test the SMA 200. Traders could look for long positions near the averages when a retest result in a bullish reaction.
Godaddy Inc (GDDY)
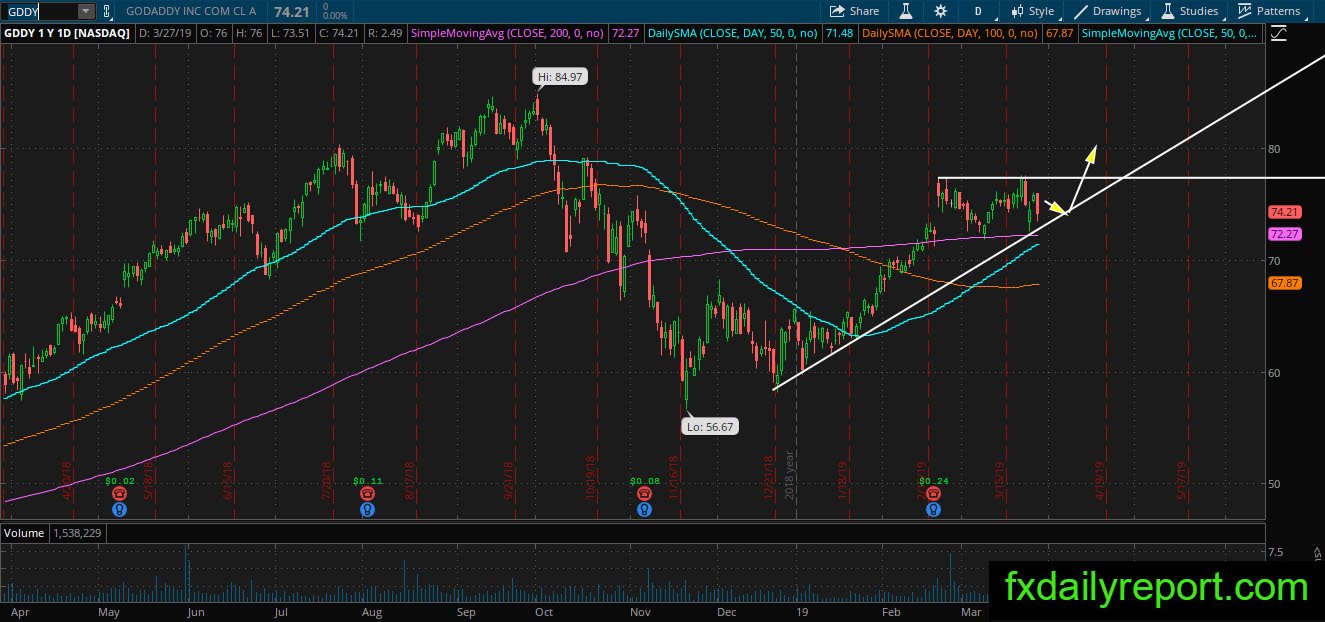
GDDY share prices have climbed above the daily SMA 200 and maintain the level above it. We could see a triangle pattern formed on the daily chart with a level of around $77.00 as the top. Aside from the trendline, GDDY has SMA 200 as a support level. Will the share prices bounced from support levels and break above the top of the triangle?