
U.S-China trade talks to resume today
After the market hit by sour mood on growth rate, traders and investors will shrug the sentiment and focus on U.S-China trade talk. Aside from the talk, there was chatter in the market about ECB policy. Central banks in Europe talking about lower deposit rate in anticipation if economic indicators turn worse.
Brexit issue also continues under focus as there is no majority vote on Brexit options by MP. Today, MP will hold another round of vote as Theresa May split her Brexit deal into two parts. The first part which related to withdrawal term will come under vote today. The second part will deal with a political declaration and will come under vote later.
Asian & European Stock market

Asian stock market closed higher. Japan stock market up 172.05 points (+0.82%) to 21,205.81, China Shanghai Composite up 95.81 points (+3.20%) to 3,090.76, and Australia ASX 200 up 4.60 points (+0.07%) to 6,180.70. European stock market slightly higher today. DAX Germany up 0.17%, UK FTSE up 0.34%, Euro STOXX600 up 0.18%.
Technical Analysis
Dow Jones Industrial Average (INDU)
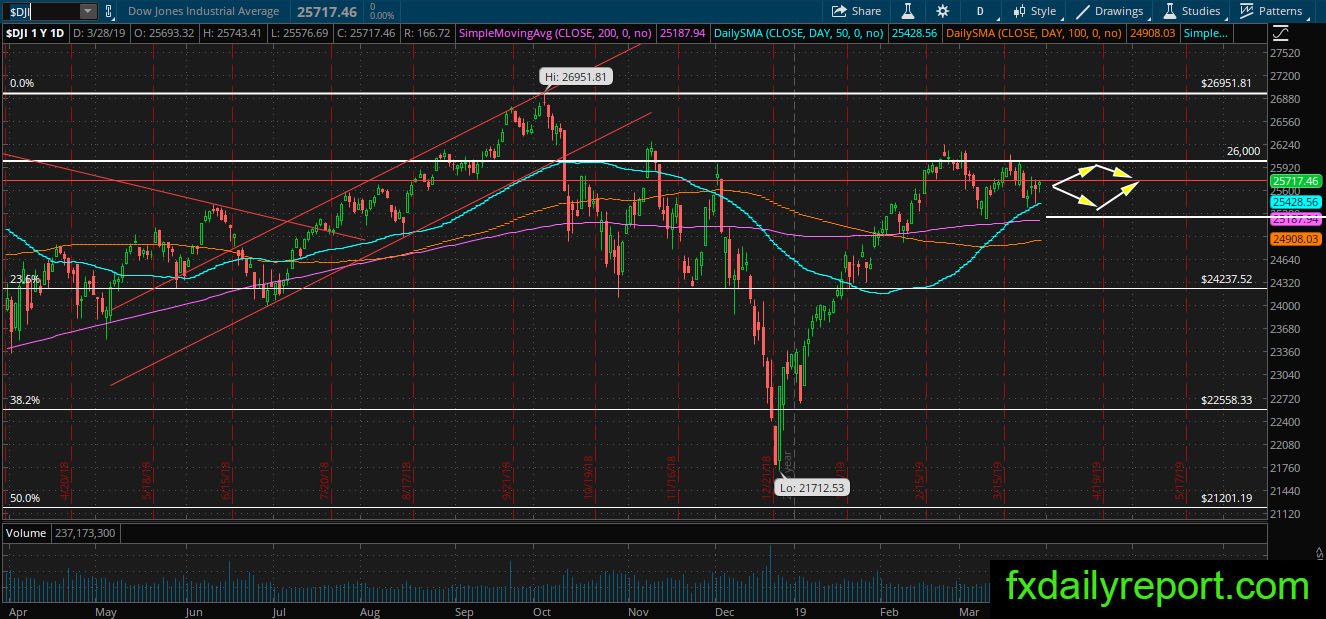
DJIA traded cautiously between SMA 50 and 26,000, there is no change to the outlook yet. This week we will see the index settled inside the range. The advance of U.S dollar index might hinder the index from moving upward and might trigger sell-off if a move below SMA 200 happens.
Tiffany & Co (TIF)
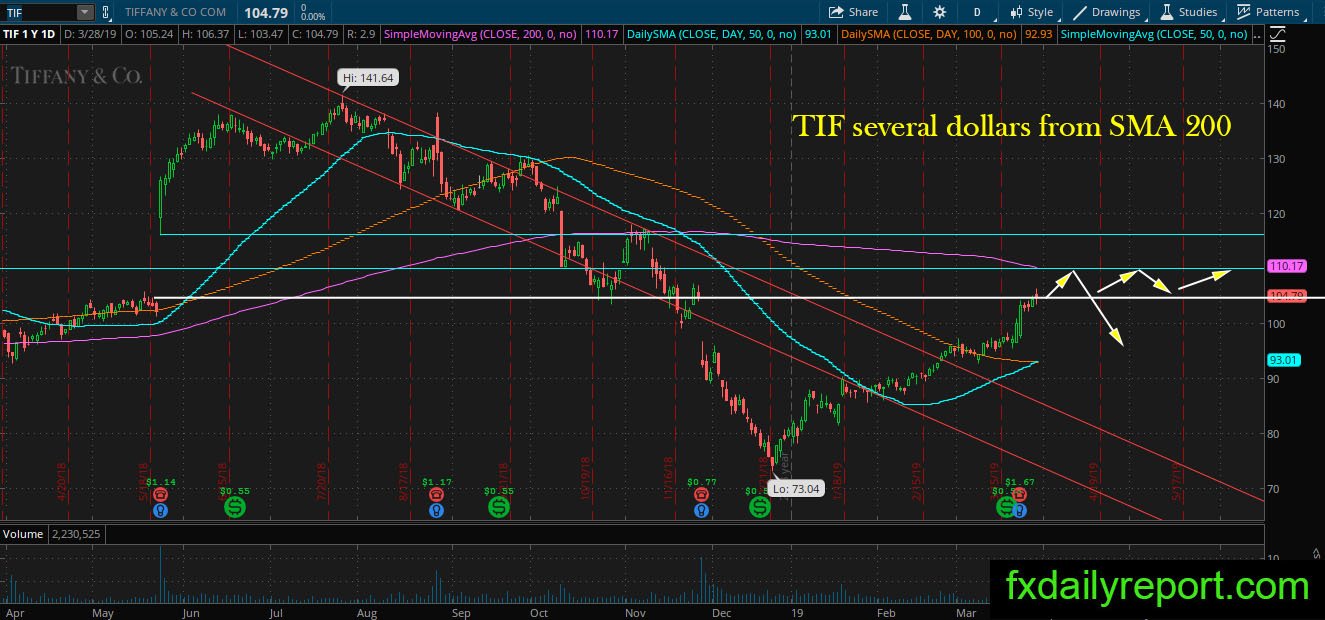
TIF bullish trend started since the share prices reach $73.04 low. The bullish trend has not finished yet and has the possibility to extend toward SMA 200. On the upside, there is a horizontal resistance level which overlaps with SMA 200. A strong rejection from the confluence level will trigger sell-off.
Wayfair Inc (W)
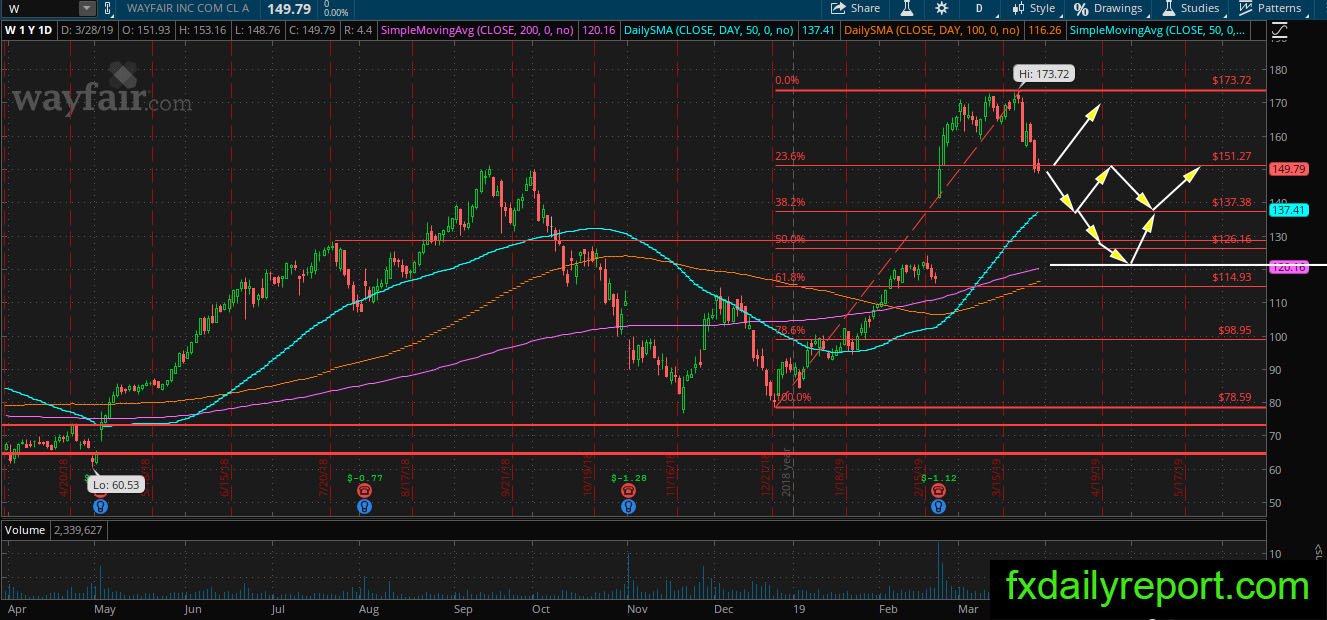
W is in bearish correction phase after the high $173.72. The share prices have not found strong support yet and should continue lower. Traders could observe 38.2% and 50% Fibonacci retracement for bounce possibility. On the lower part, daily SMA 200 might become the major support and ideal level for long positions if the share prices manage to reach it.