
Oil Relief and Tech Surge Propel Dow 600 Points Higher; S&P 500, Nasdaq Hit Session Highs
U.S. equities rallied sharply in Wednesday afternoon trade, with the major averages posting broad-based gains as sliding crude prices and a fresh wave of upbeat corporate results fueled a strong rebound in risk appetite. The Dow Jones Industrial Average jumped more than 600 points, getting near to its all-time peak, while the technology-heavy Nasdaq Composite led the charge once again.
Official closing levels are still being tallied, but near the final bell the Dow stood at 49,935.68, a surge of 637.43 points, or 1.29%. The S&P 500 advanced 100.81 points, or 1.39%, to 7,360.03, and the Nasdaq soared 472.84 points, or 1.87%, to 25,798.97. Sentiment was underpinned by reports of progress in Iran nuclear deal negotiations, which pressured oil prices and eased stagflation fears, while a blowout earnings report from AMD reinvigorated the semiconductor space.
Dow Jones Industrial Average (INDU)

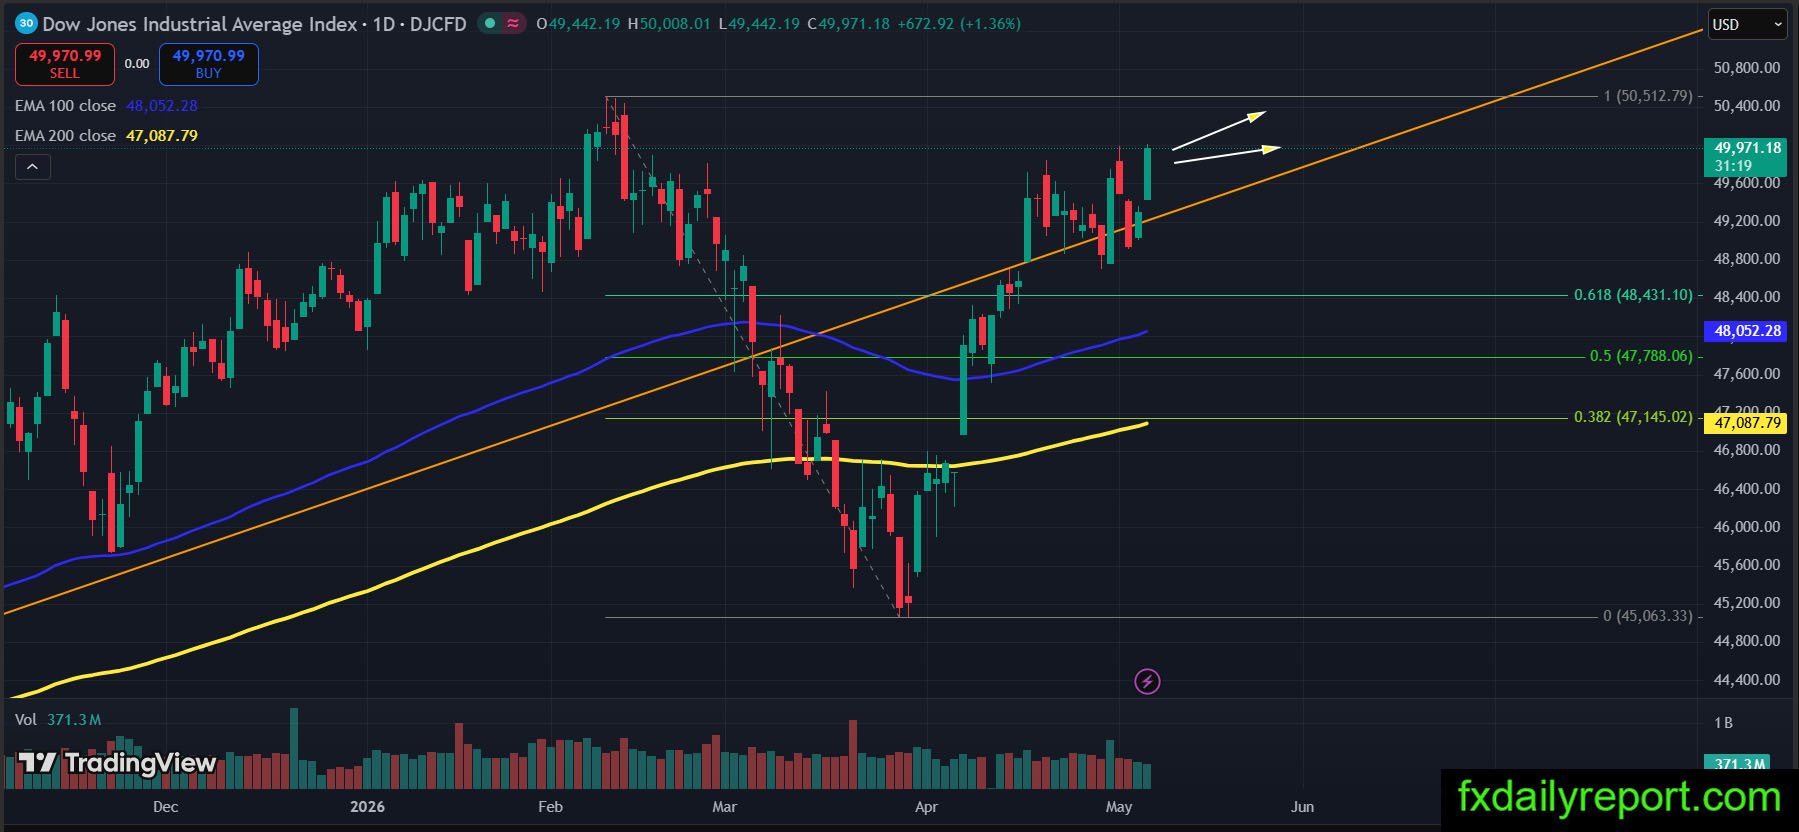
The DJIA index finally delivered the upside resolution traders were waiting for. After Tuesday’s session printed a clear inside bar, the index exploded higher today, negating the prior consolidation with conviction. The move not only broke above Monday’s high but also printed a new higher swing high, reinforcing the bullish breakout scenario discussed yesterday. With momentum firmly behind it, the path of least resistance now points toward a retest of the record high. Shallow pullbacks that hold above the breakout area would be healthy for continuation, while a reversal back below that prior resistance would be the first sign that the breakout is fading.
First Solar, Inc. (FSLR)
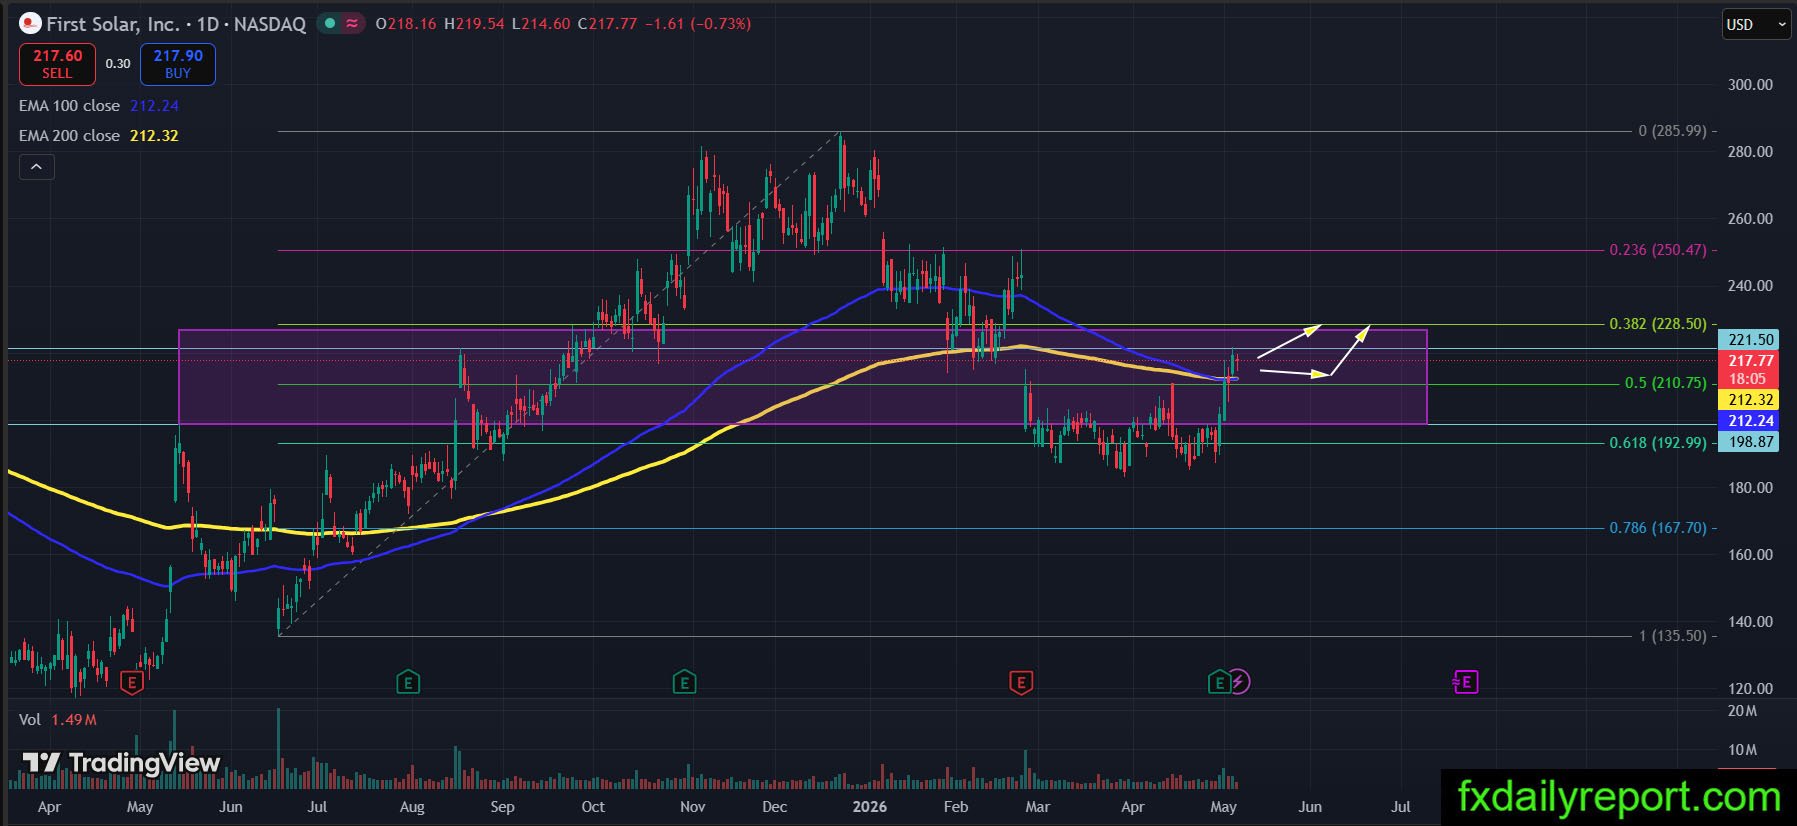
First Solar shares staged a compelling technical turnaround. After a bearish dip that briefly pierced the purple support zone, the stock formed a clear bottom and has since carved out a new higher swing high. This sequence suggests the prior correction has run its course and that a fresh bullish leg may be taking shape. The structure is now constructive for longs, and traders should prepare for possible retest on the EMA. In the event of a bearish retracement, the convergence of the 100-day and 200-day EMA stands out as the critical support floor and a logical area to add into long positions.