
Wall Street Marks Mixed Gains as Dow Anchors Near Highs While Tech Pauses
U.S. equities demonstrated divergent performance on Wednesday, with the blue-chip average pressing toward its upper boundaries while a distinct pause in the technology sector tempered broader market gains. A decline in oil prices provided a steady tailwind for industrial shares, helping the Dow lead the day’s advances. Conversely, a temporary cooling phase in the high-flying semiconductor space kept a tight lid on the rest of the market. By late afternoon, the market snapshot showed the S&P 500 up a marginal 6.06 points (0.08%) to 7,525.18, while the tech-heavy Nasdaq Composite edged up just 16.20 points (0.06%) to 26,672.38.
Dow Jones Industrial Average (INDU)
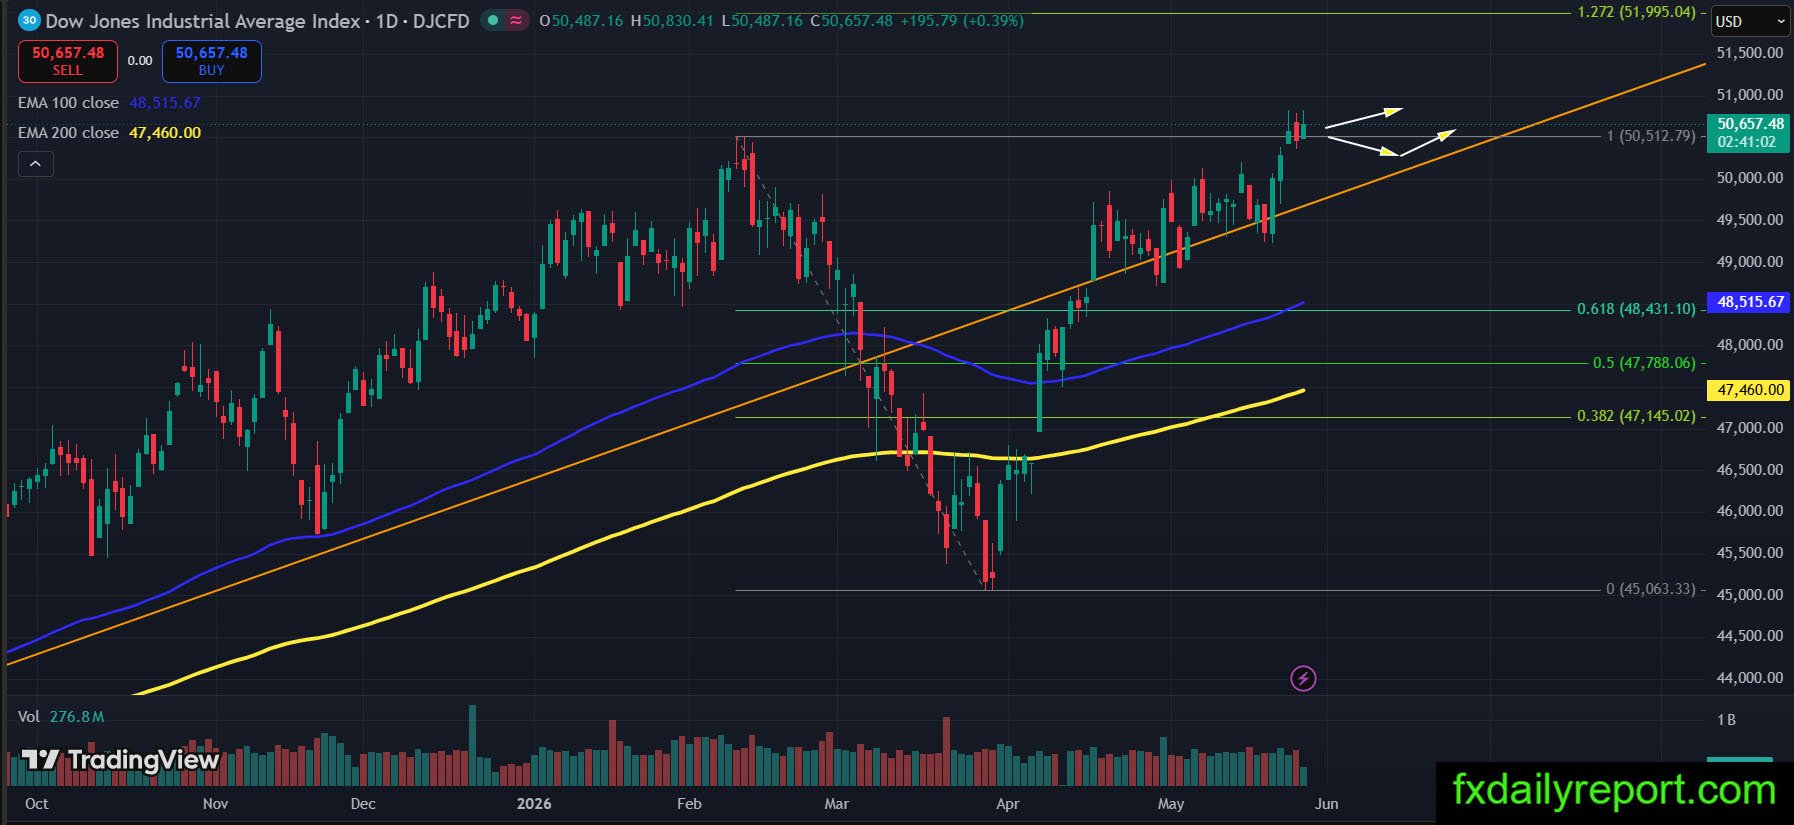

The DJIA index successfully maintained its position near high, attempting to spark another leg upward to build on its prevailing bullish structure. However, the index stopped short of printing a fresh higher high during the session, signaling that the market is temporarily consolidating and waiting for a stronger fundamental trigger to clear overhead liquidity. By the late afternoon update, the blue-chip index was outperforming the broader market, trading at 50,702.46, up 240.78 points or 0.48%, keeping the long-term macro target at the 127.2% Fibonacci extension level (51,995) firmly intact.
NVIDIA Corporation (NVDA)
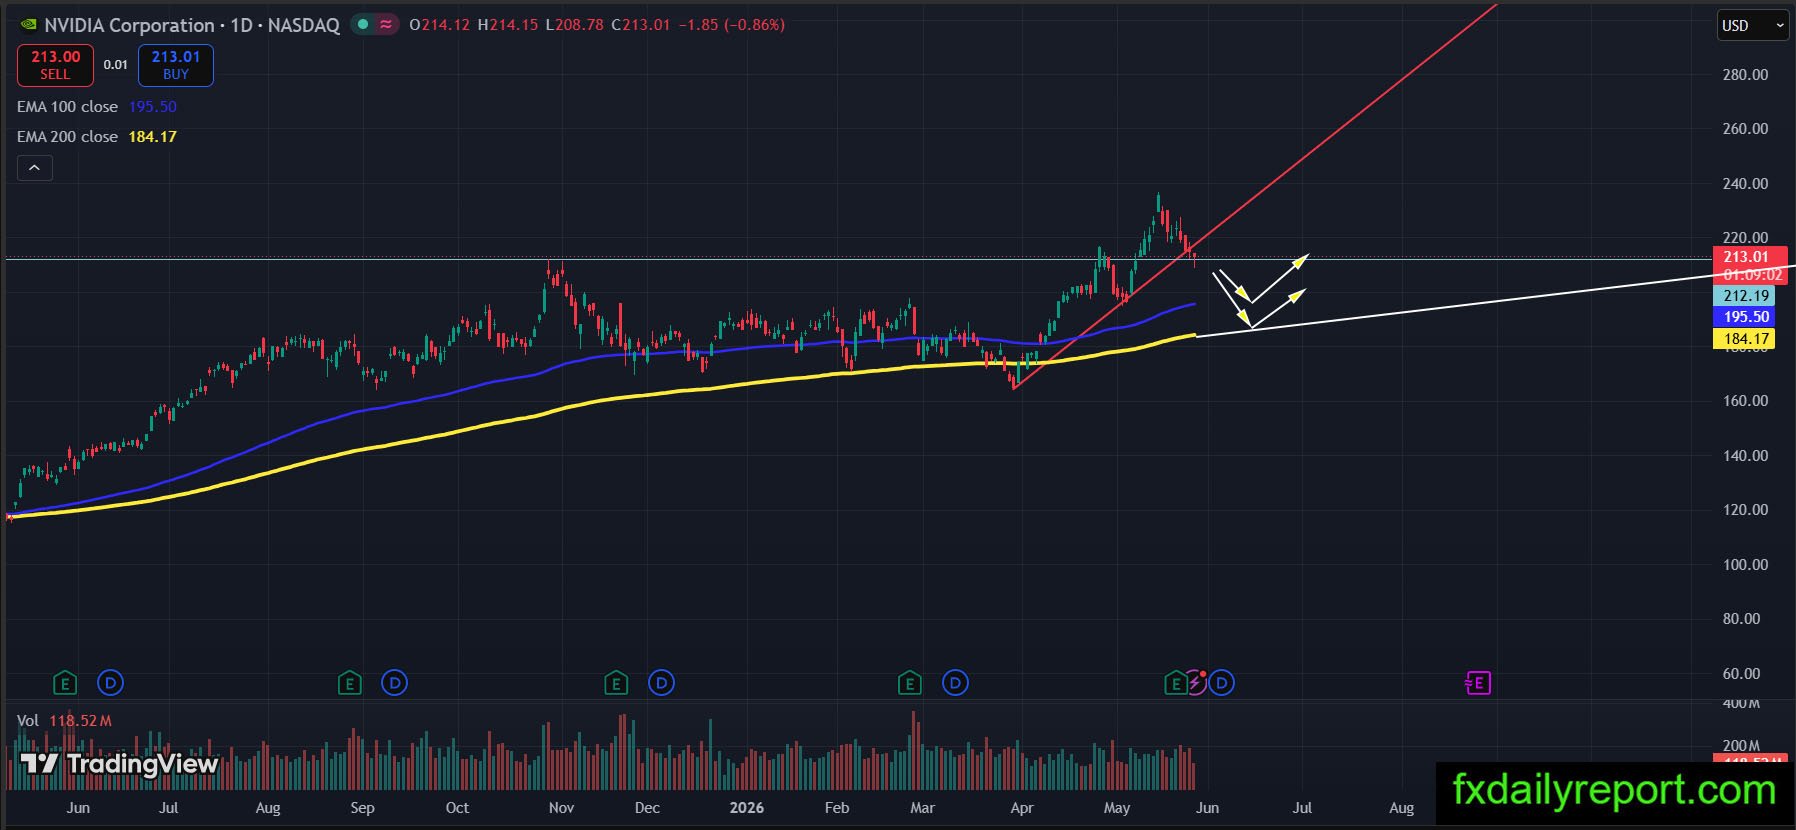
NVDA shares have entered a minor cooling phase, with the stock pulling back to find itself interestingly situated at a critical technical level where an ascending trendline converges with a major horizontal line that previously acted as resistance. Currently trading around $213.01, a clean bullish bounce from this structural support confluence would validate the underlying demand and signal an immediate continuation of the broader upward movement. Conversely, if a deeper bearish breakdown happen, the key technical cushion to watch for dynamic bounce reactions lies lower within the daily EMA 100 ($195.50) and EMA 200 ($184.17) territory.