
U.S watchlist send jitter to the market
In the previous day, U.S add 9 countries to the watchlist for monitoring for possible currency manipulation. The 9 countries are China, Germany, Ireland, Italy, Japan, Malaysia, South Korea, Singapore, and Vietnam. Most of the currency of the country in list pulled-back against U.S dollar.
The trade war between U.S-China might add more pressure after China signaled a hidden threat over rare-earth mineral. The country warned that any products made from the mineral must not be used against China’s development. The technology sector is the one who will suffer if China decided to raise price or limit exports of the mineral.
Asian & European Stock market

Asian stock market mostly higher. Japan’s Nikkei up 77.56 points (+0.37%) to 21,260.14, China stock market up 17.53 (+0.61%) to 2,909.91, and Australia ASX 200 up 32.90 points (+0.51%) to 6,484.80. European stock market mixed on Italy – Europe concern. DAX Germany down 0.19%, UK FTSE up 0.30%, Euro STOXX600 down 0.09%.
Technical Analysis
Dow Jones Industrial Average (INDU)
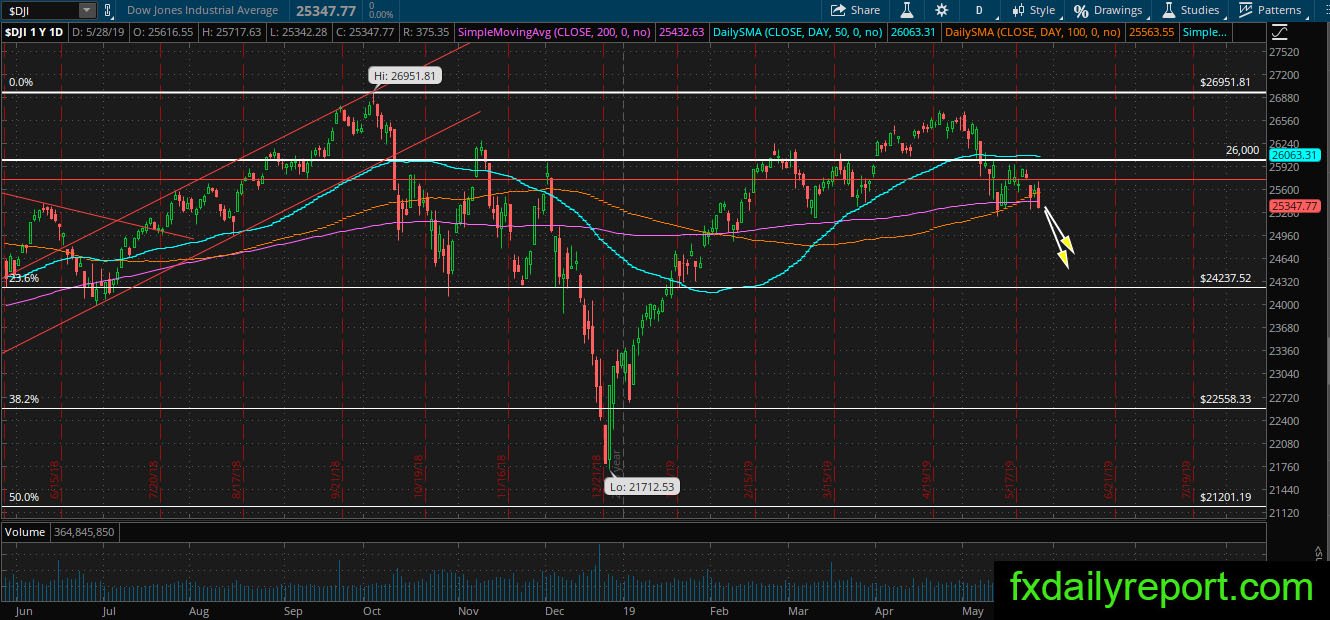
The bearish alarm is screaming for short as DJIA made strong bearish close yesterday. It crossed below SMA 200 and might add further loss today as DJIA futures pointed lower more than 200 points. If the bull could not reverse current bearish pressure then DJIA expected to print lower low and start new bearish leg with SMA 200 as the level to bounce lower.
Franklin Resources (BEN)
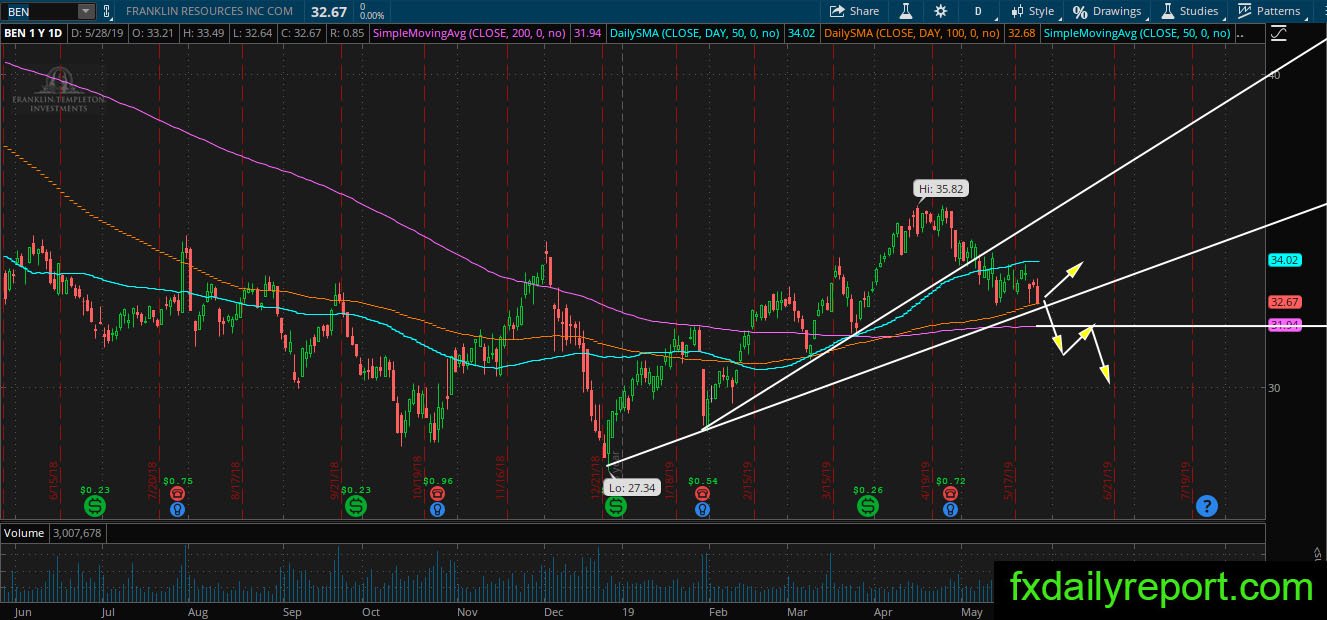
No change of trend yet in BEN as long as the share prices holdout above daily SMA 200. However, the global market situation might put recent bullish attempt into nothing. At the current time, BEN holding out above SMA 100 and the trendline. Will it breakout lower and test the daily SMA 200?
Chipotle Mexican Grill (CMG)
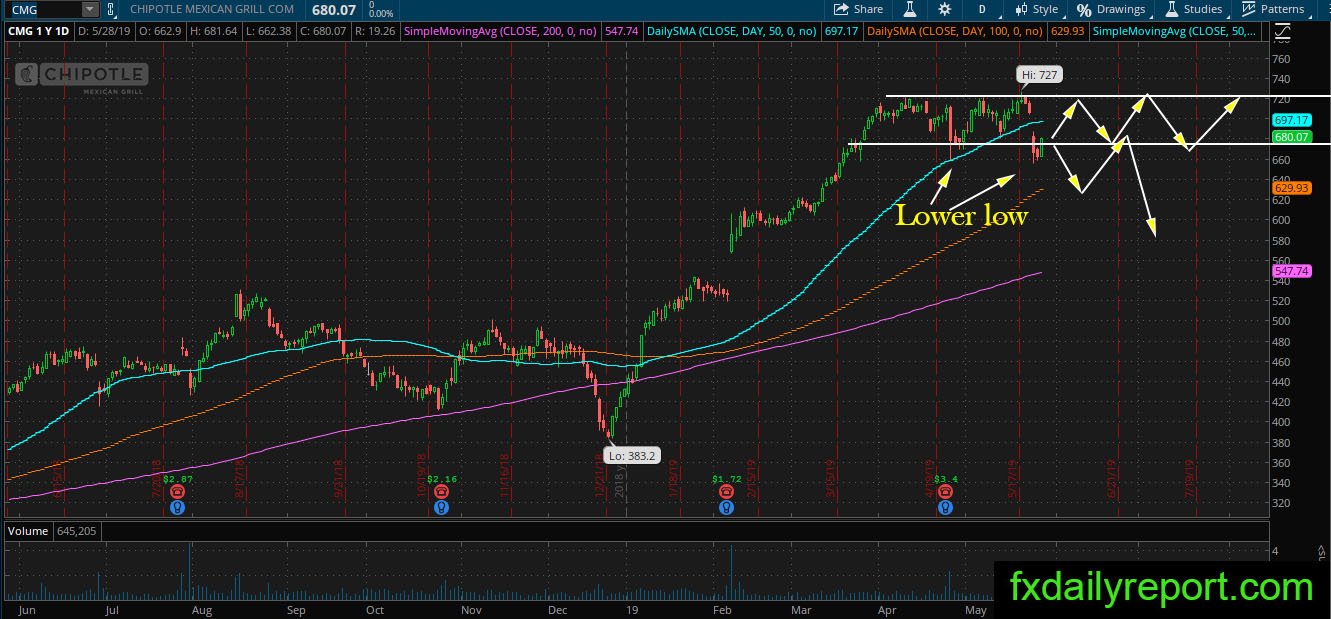
CMG share prices have enjoyed a long-term bullish trend when it returned above the SMA 200. At the current time, the bullish trend has weakened and lower low printed on the chart. The share prices might range between two horizontal lines or close below the line and start bearish correction toward SMA 100 & 200.