
Shaky market as Russia probe
U.S stock market advantage this week might come to a test as special counsel Robert Mueller issued subpoenas to Trump’s officials, demanding to surrender document related to Russia. The subpoena case put President Trump effort on passing the $1.5 trillion tax-reform subdued. The Tax-bill still need approval by Senate later which is a big hurdle.
Asian stock market mixed on the last day of the week. Nikkei up 45.68 points (+0.20%) to 22,396.80, Shang Hai Composite down 16.91 points (-0.50%) to 3,382.34 and Australia ASX 200 up 13.74 points (+0.23%) to 5,957.25. European stock market also mixed. DAX Germany up 0.12%, FTSE UK up 0.10%, and Euro STOXX 600 down 0.16%.
Technical Analysis
Dow Jones Industrial Average (INDU)

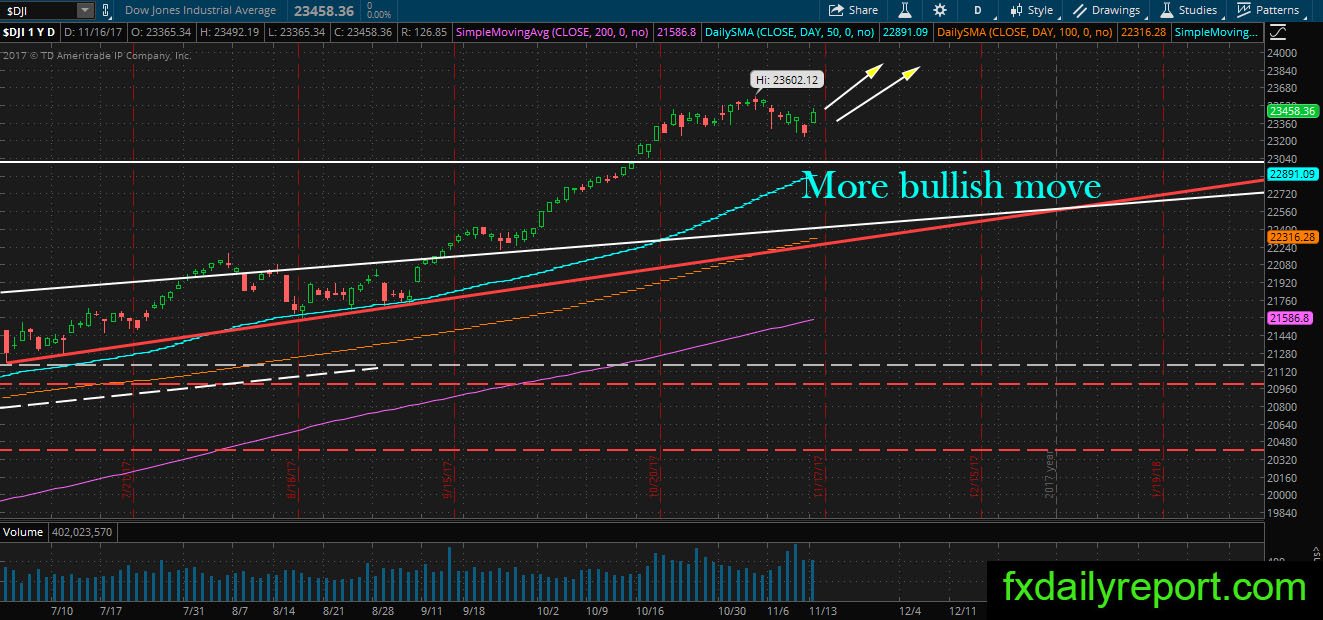
DJIA jumped on Thursday and put an end to the correction period. However, the winning of the stock market might reverse today as the futures pointed down 22 points. Overall, there is mix news on the market. Optimist side looks at the tax-bill positive development, but pessimistic side looks at possibility Russia probe lead to President Trump.
Technically, the trend of DJIA is up and no change to the current outlook yet.
The Travelers (TRV)
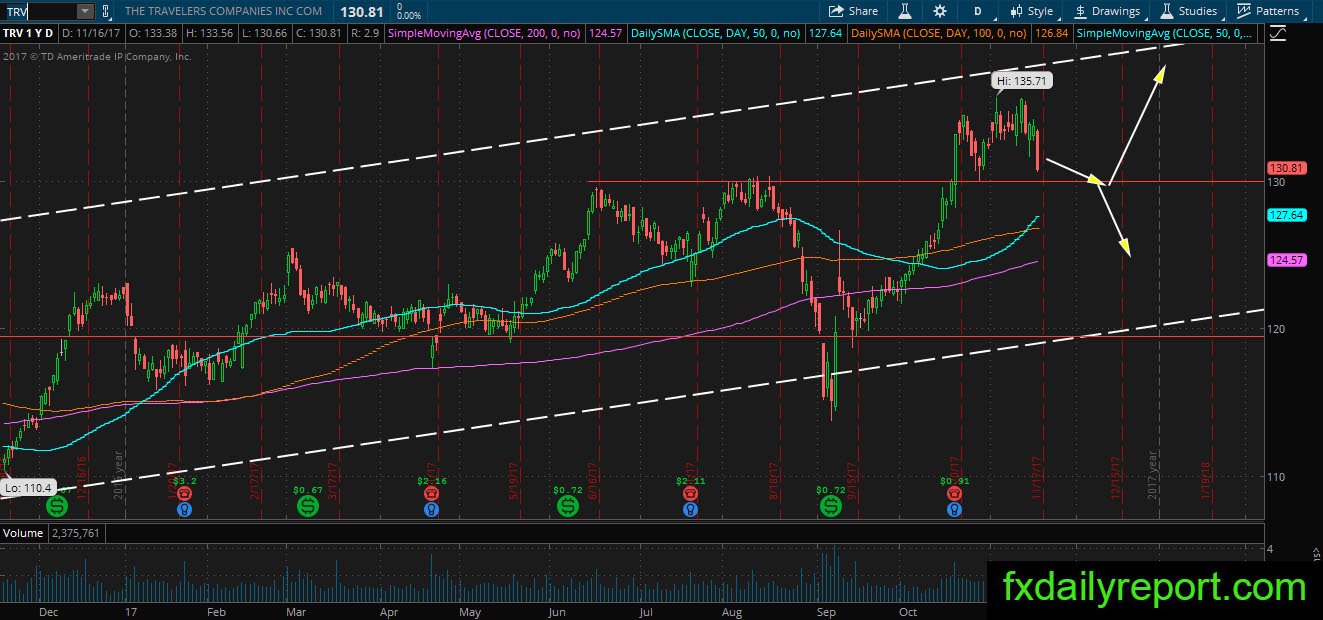
TRV has broken above $130.00 in the past and bounce after re-test. Currently, the share prices back lower to test the support level. The bearish momentum is strong which suggest traders wait until the momentum recede. Traders will watch area between daily SMA 100 – $130.00 for a long position.
United Tech Corp (UTX)

The share prices of UTX claimed level above daily SMA 200 and currently testing it. There is indication bounce in progress. Meanwhile, the share prices bouncing between daily SMA 100 and 200 with a bullish bias. On the upside, traders could target $120.00 as the long target.
Other Watchlist
EBAY – The share prices hit its daily SMA 200 and show indication of bounce. Might continue upward.
BP – There is a chance for a bounce from daily SMA 50.