
Shaky market before Friday NFP
Non-farm employment is the vital data awaited each month to gauge if current Fed policies encourage growth rather than taking it off. On Friday, analysts expect in October 311k job added which is a contrast to the previous result of -33k in September. The bar is high and lower number might shake the market.
Dow Jones Industrial Averages futures down 26 points in European session as the market waiting for BOE interest-rate announcement. It might be the first time BOE increase interest-rate since a decade ago. The event is widely expected by the market, and it is not the interest-rate hike which becomes the focus, but the future outlook from BOE. Currently, the market expects two rate hike by November 2018 and three rate hike by March 2020. Nevertheless, expect some movement in Pound Sterling which will influence U.S dollar and the stock market.

Asian stock market down on cautious note today. Nikkei up 119.04 points (+0.53%) to 22,539.12, Shang Hai Composite down 12.77 points (-0.38%) to 3,383.14, and Australia ASX 200 down 6.06 points (-0.10%) to 5,931.71.
Technical Analysis
Dow Jones Industrial Average (INDU)

Anticipation on tax-reform propelled DJIA higher on Wednesday, but Republican decided to postpone tax-bill and announced it on Thursday. DJIA expected to continue its sideways movement and open higher as the tax-bill released. However, depending on market reaction, the tax-bill content might trigger selling if not as promised.
Kellogg Co Com (K)
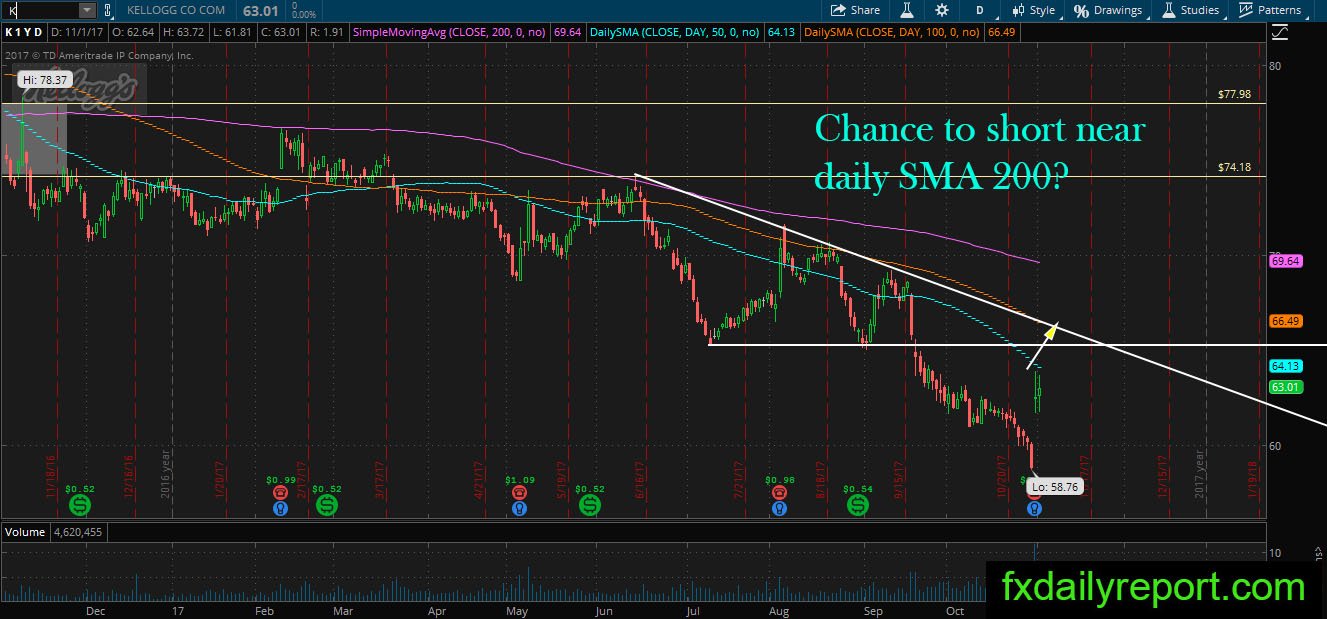
K boosted after reported earnings result on Monday. The share prices hit level near daily SMA 50 and consolidate. There is a possibility the share prices could advance further to resistance around $65.00 and daily SMA 100. Traders could use this opportunity to look for the short position if the momentum slowed down.
Target Corp (TGT)

TGT downward correction landed on the daily SMA 50 where it expected to bounce. There is stronger support below the averages, the daily SMA 200. Traders could look for long position and ride TGT higher on new bullish trend above daily SMA 200.