
Strong job data smashed expectation
The market boon by the hope of possible reconciliation between U.S and China. President Trump reported hoping to reach a trade deal with China on the G-20 summit later this month. Meanwhile, economic data show strong growth in Job and wages. Non-farm employment logged 250k job addition, topped analysts 194k forecast. Wages also higher 3.1% from a year ago.
However, trade balance shows a negative 0.4 billion vs. surplus 0.2 billion. U.S dollar index recovered to its opening prices today and showing buying activity before U.S market open.
Asian & European Stock market

Asian stock market solidly higher today. Nikkei up 556.01 points (+2.56%) to 22,243.66, China stock market up 70.24 points (+2.70%) to 2,676.48, and Australia ASX 200 up 8.40 points (+0.14%) to 5,849.20. European stock market also climbing. DAX Germany up 1.48%, UK FTSE up 0.66%, Euro STOXX600 up 0.95%.
Technical Analysis
Dow Jones Industrial Average (INDU)
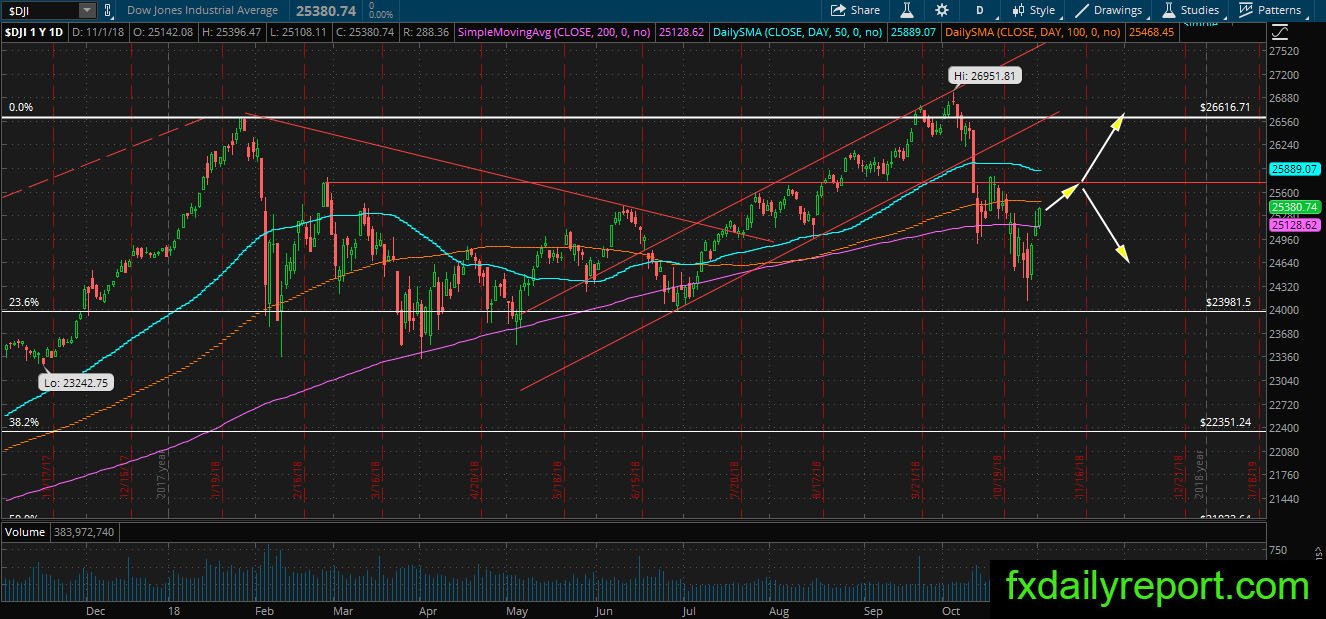
Dow Jones Industrial Averages started the month November to the upside and today the index futures relatively higher after job data. The index futures up 189 points before the market open. However, strong job data might upped the expectation for more rate-hikes by the Fed which is not a good news for DJIA. The index might test the level around 25.750 before deciding next direction.
JP Morgan Chase (JPM)

The share prices might become the target for short position when it hit the daily SMA 200. Traders will prepare near the averages and monitor the price reaction near it. A strong sign of weakness by the bearish pattern is a sign to jump in short positions.
Lowes Cos Inc (LOW)

LOW creep up and reach its daily SMA 200. The bull is struggling to cancel breakout below the averages and turn LOW into a bullish trend again. Traders could use the moment to place long position with a tight stop below current swing low.
Tiffany & Co (TIF)
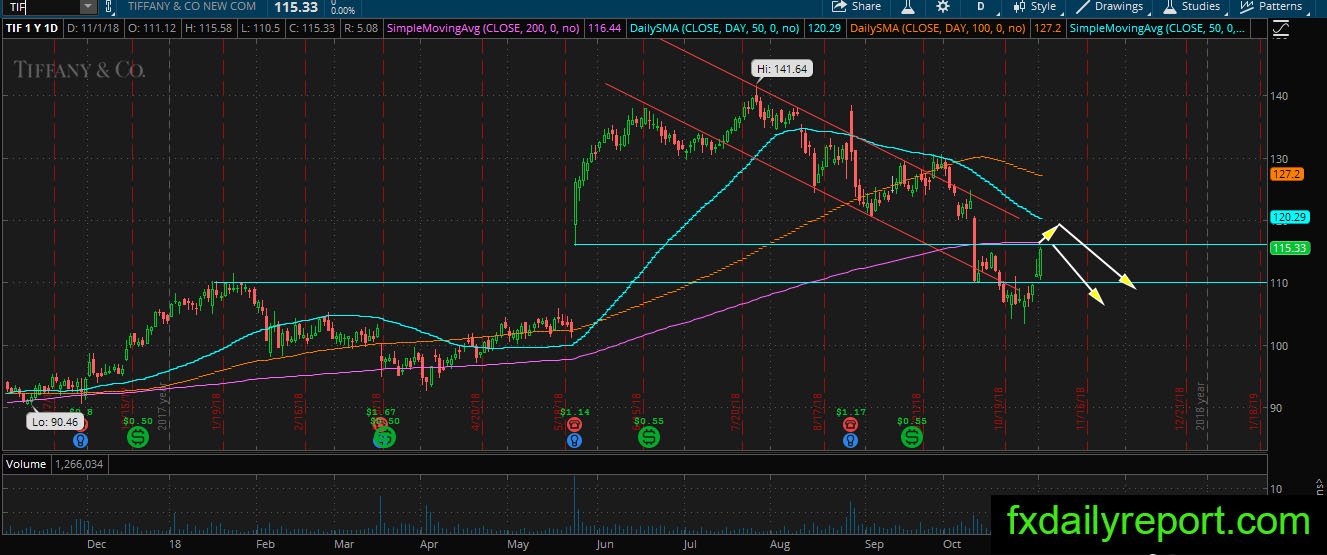
TIF is another short candidate as the share prices moving in a bearish channel and currently testing daily SMA 200 from below. If the bear could stall the share prices at the SMA 200 then there is high chance TIF will start rolling down next week. On the other hand, a close above SMA 200 followed by a close above the top of the channel will trigger a new bullish trend in TIF.