
Welcome 25,000 in DJIA, welcome volatility
It only took two days to bring DJIA down from 26,000 to 25,000. The index futures drifted on the positive sides which mean correction will happen. However, the selling seems not finished yet, especially when yield continues moving up.
Inflation data in the previous day came out below expectation and the market seems weighing the option that the Fed will not increase interest-rate. Bond-yield moves down when the data released but start to increase again in today session. There are speeches by Federal Reserve members today which might move the market. Aside from news, global sentiment is positive in the ·Asian and European market.
Asian & European Stock market

Asian stock market recovers part of losses. Nikkei up 103.80 points (+0.46%) to 22,694.66, China stock market up 23.45 points (+0.91%) to 2,606.91, and Australia ASX 200 up 11.90 points (+0.20%) to 5,895.70. European stock market also rebound from low. DAX Germany up 0.49%, UK FTSE up 0.69%, Euro STOXX600 up 0.45%.
Technical Analysis
Dow Jones Industrial Average (INDU)

A second-day massive drop in DJIA brought the index below daily SMA 200 and could sign the shift to a bearish trend. Fortunately, the bull still has a chance to cancel the bearish outlook by recovering the index above SMA 200 before the weekend. Next week, the market will focus on the index movement near SMA 200. Weakness or strong selling from the averages will lead to a continuation of the bearish trend.
Crocs Incorporated (CROX)
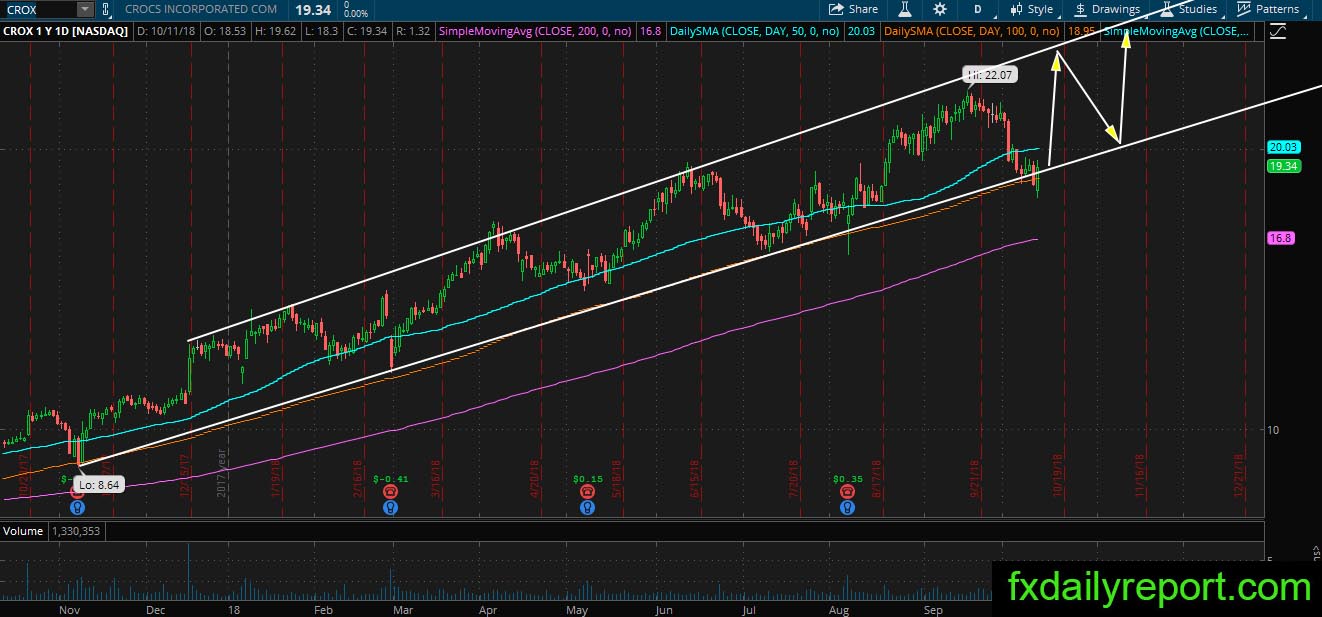
CROX comfortably move above the trendline and form a bullish channel. The channel has not broken and the share prices found support at daily SMA 100. If the bull could push the price higher then we could see a continuation of a bullish trend.
Mcdonald (MCD)
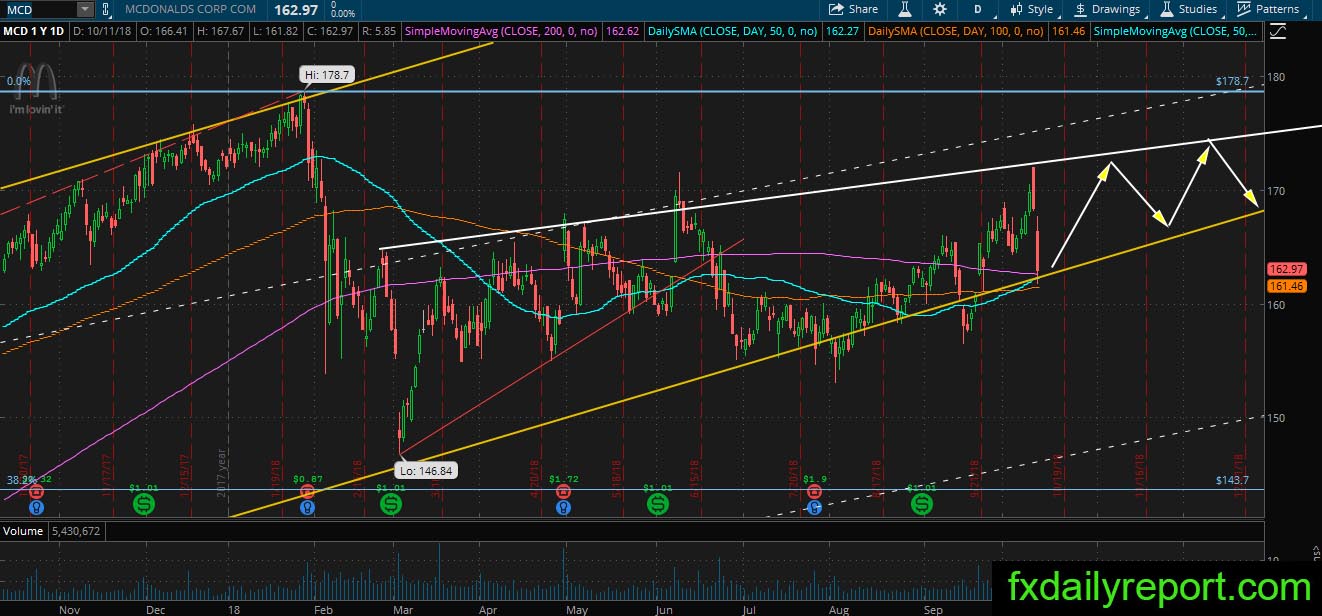
Upgrade in the share prices target brought MCD to open above $170.00. Unfortunately, the uptick in bond-yield scare the market and there is no mercy on MCD share prices. It follows the global market sell-off. But, there is no breakout below SMA 200. As long as there is no breakout below the averages, there is a chance for MCD to start moving up again.
Visa Inc (V)
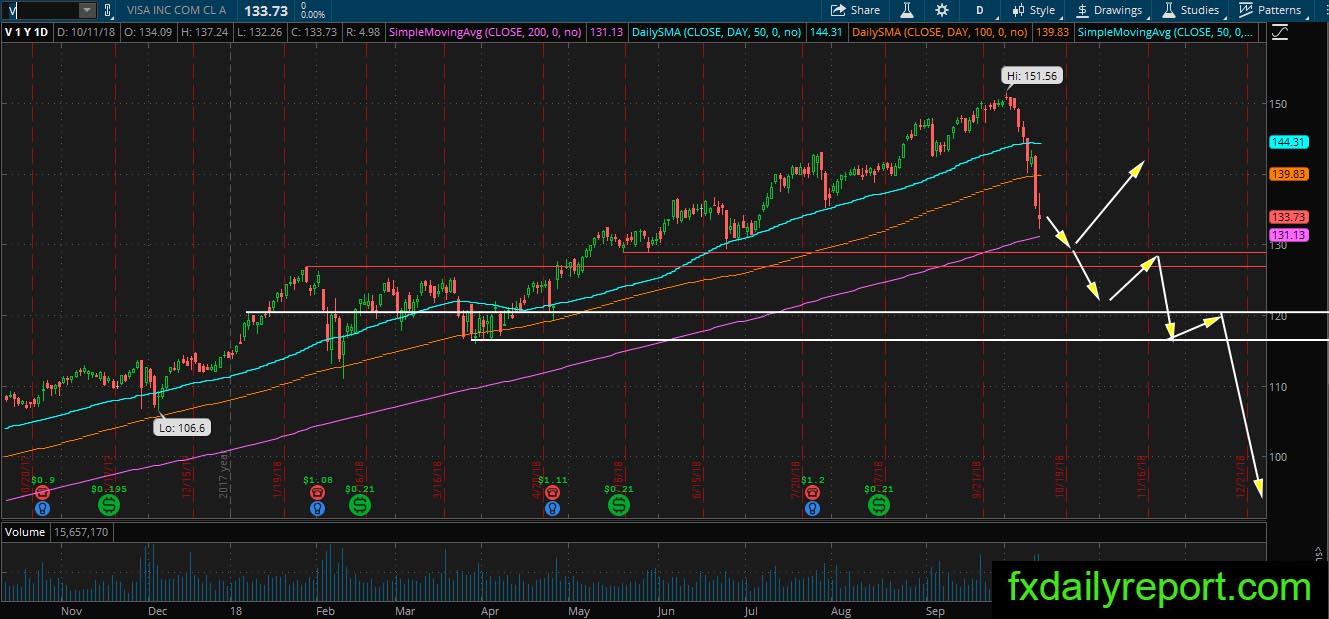
Visa pullback following the global market rout and it almost reach the daily SMA 200. There is a flip level present near the averages and could act as bounce level. Traders could watch both SMA 200 and flip level as the place to take a long position when a strong bullish pattern formed.