
DJIA: This week goal is 23,000
U.S stock market finished higher in the previous week and DJIA print new record high at 22,905.33. The outlook continues positive for the index as the market bets for strong earnings season. Earnings season kick-off with a strong start with more than 80% of companies that have reported topped analyst expectation.
Meanwhile, from the crude oil market. The price gained in Monday trading after news that Iraqi force captured Kurdish Peshmerga base near Kirkuk. The move was made after the independece vote last week done by the Kurdish region in Iraq. If war breaks out between U.S allies, it might push oil prices higher.

Asian stock market rise on Monday following the positive lead from Friday U.S stock market. European stock market expected to open higher and to extend previous week gain. But, the gain might be limited as political news take hold this week.
Technical Analysis
Dow Jones Industrial Average (INDU)

DJIA print another record high on Friday trading session. The index might continue its upward movement this week and reach 23,000 if there is no major shift in the fundamental situation.
Dunkin Brands (DNKN)

DNKN share prices are interesting to monitor as it moves back above the daily SMA 200 and makes higher high on the daily chart. The share prices sold on Friday and moved lower near its daily SMA 200. Traders could look for the long position after the retest.
Verizon Communications (VZ)
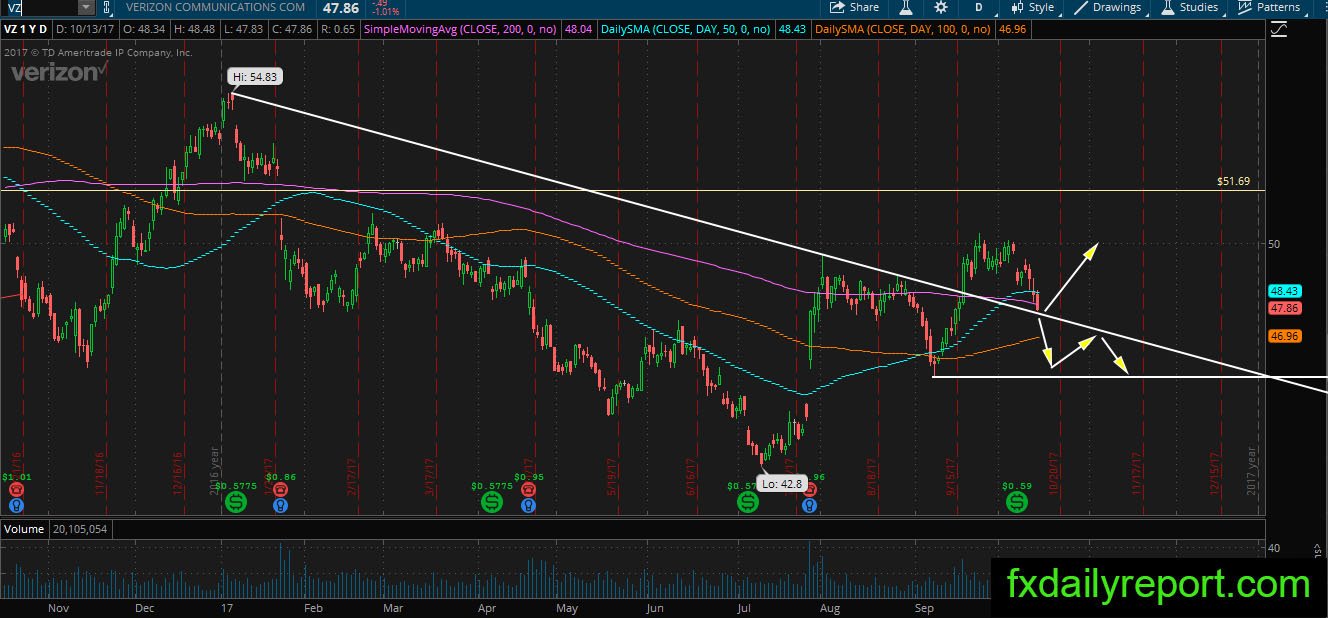
The outlook of VZ turns positive as the share prices move above its downtrend line and daily SMA 200. However, Friday close might put the bull under alert as it closed below the SMA 200. If VZ could print a bullish candlestick above daily SMA 200 and $48.85, it might trigger new bullish leg bounce from the white trendline.
United States Steel (X)

The bull is struggling in X share prices after it gapped down below daily SMA 200, but stay persistent to avoid further sell-off. The share price has tested level near $28.00 twice which resulted in rejection in the past. Currently, X is testing the level and daily SMA 200. Will it break upside? Alternatively, will it rejected and started moving lower?
If the share prices move lower, there is an opportunity to enter long position near the white trendline.
Other Watchlist
CMG – Possible start of new bullish leg from $300, currently surpassing resistance around $320