
Equity market back to defensive before minutes of the meeting
The stock market futures in the U.S collectively lower before the release of FOMC minutes of meeting today. It is a normal situation after previous day surge of more than 500 points. Currently, Dow Jones Industrial Averages pullback 100 points.
The pullback in the stock market might not hold long as economic data show strong results combined with a better than expected report from companies. Today, Netflix (NASDAQ: NFLX) topped analysts expectation by reporting eps of $0.89 vs. $0.68. Revenue in-line with forecast and the company added new 6.96 subscribers. Share prices up more than 11% in pre-market trading.
Asian & European Stock market

Asian stock market bolstered by gain in U.S market. Nikkei up 291.88 points (+1.29%) to 22,841.12, China stock market up 15.29 points (+0.60%) to 2,561.61, and Australia ASX 200 up 69.20 points (+1.18%) to 5,939.10. European stock took different path lower . DAX Germany down 0.50%, UK FTSE up 0.19%, Euro STOXX600 down 0.22%.
Technical Analysis
Dow Jones Industrial Average (INDU)

DJIA bounced from daily SMA 200 and launched upward more than 500 points. The reaction from averages was strong and mark the beginning of earnings season. If the bull could press further upside then we might see a continuation of the long-term bullish trend.
Paypal Inc (PYPL)
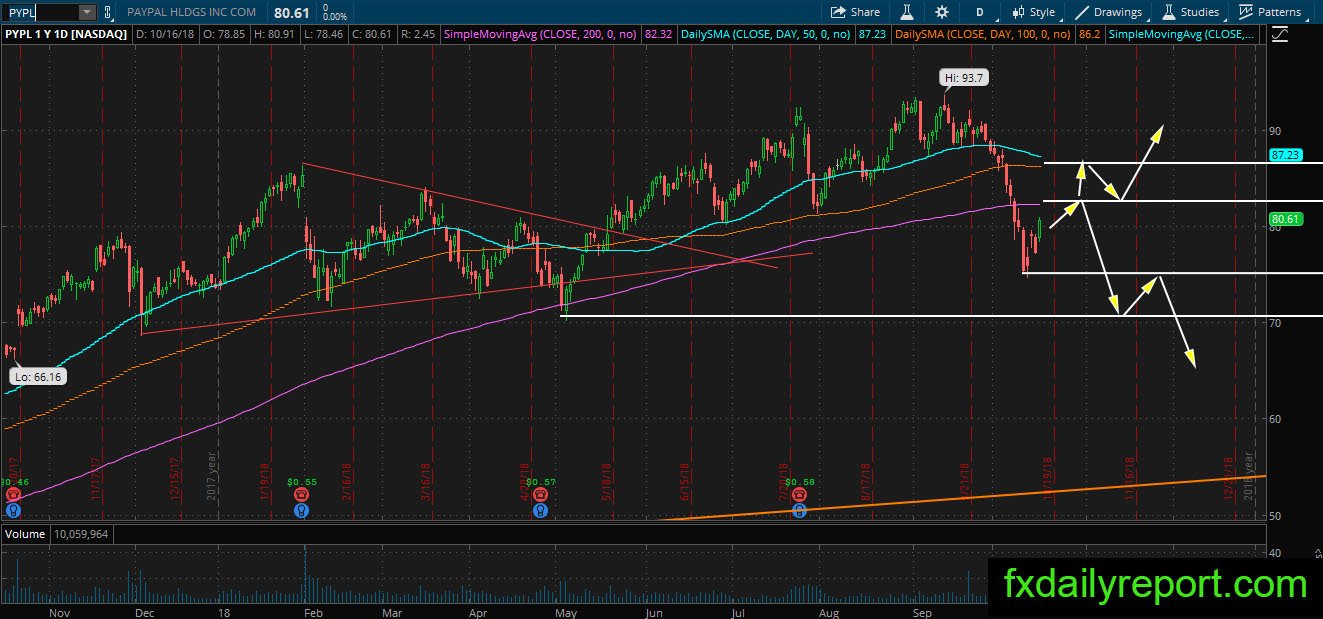
Big trouble seen in PYPL, following the breakdown below SMA 200. The share prices might be moving up right now, however, it is expected to be rejected near the SMA 200. Traders will watch how the price reacted near the averages. Which one will happen first? a breakout or rejection? As the trend has turned bearish, it is better to stick to the short side.
Exxon Mobil (XOM)

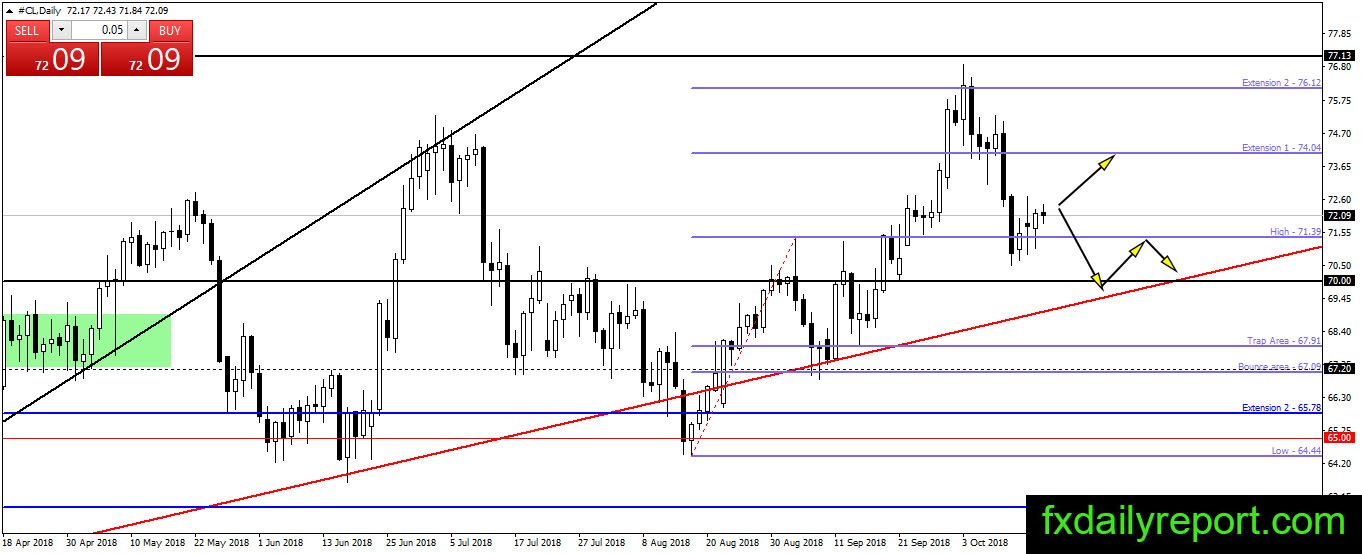
XOM share prices movement mirroring oil prices movement. The fall of oil lead the share prices down and both currently traded at the support level. We think the bullish trend in oil has not finished yet and a bounce is bound to happen. Traders could use the daily SMA 200 on XOM daily chart to look for a long position.