
Mixed job data drive U.S stock futures down
U.S Non-farm employment data add 134,000 jobs in September, the number is lower than estimate 185,000. Meanwhile, unemployment on track lower at 3.7% vs. 3.8% expectation. Dow Jones Industrial Averages futures down 23 points after the releases.
Despite the tariff implemented by the U.S in trade wars, the trade deficit widened to $53.2 billion. We might see more reaction by President Trump in U.S-China tariff war.
Asian & European Stock market

Asian stock market settled lower at the end of week. Nikkei down 191.90 points (-0.80%) to 23,783.72, China stock market stay closed on holiday, and Australia ASX 200 up 9.20 points (+0.15%) to 6,185.50. European stock market descends. DAX Germany down 0.77%, UK FTSE down 0.77%, Euro STOXX600 down 0.55%.
Technical Analysis
Dow Jones Industrial Average (INDU)
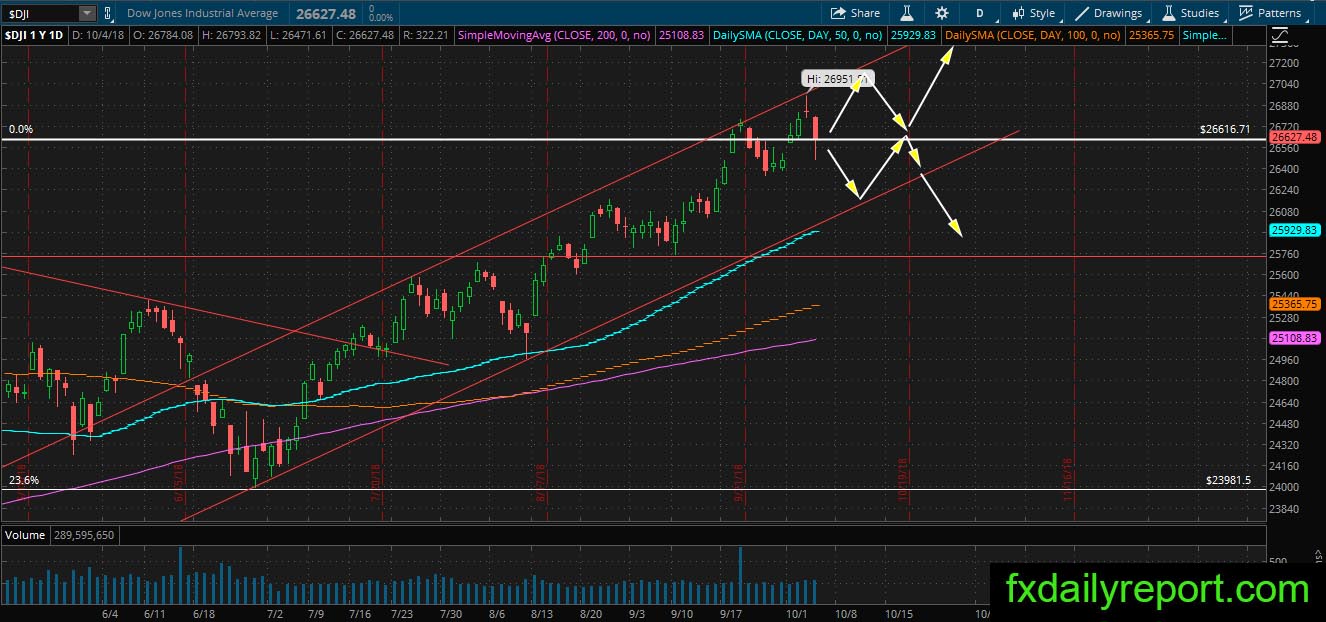
Sell-off happen after the rejection from top of the channel in Dow Jones Industrial Averages. The bearish momentum is strong, but manage to hold above Jan’18 high. Will the bull maintain the bullish momentum and climb again from the current level?
Home Depot Inc (HD)
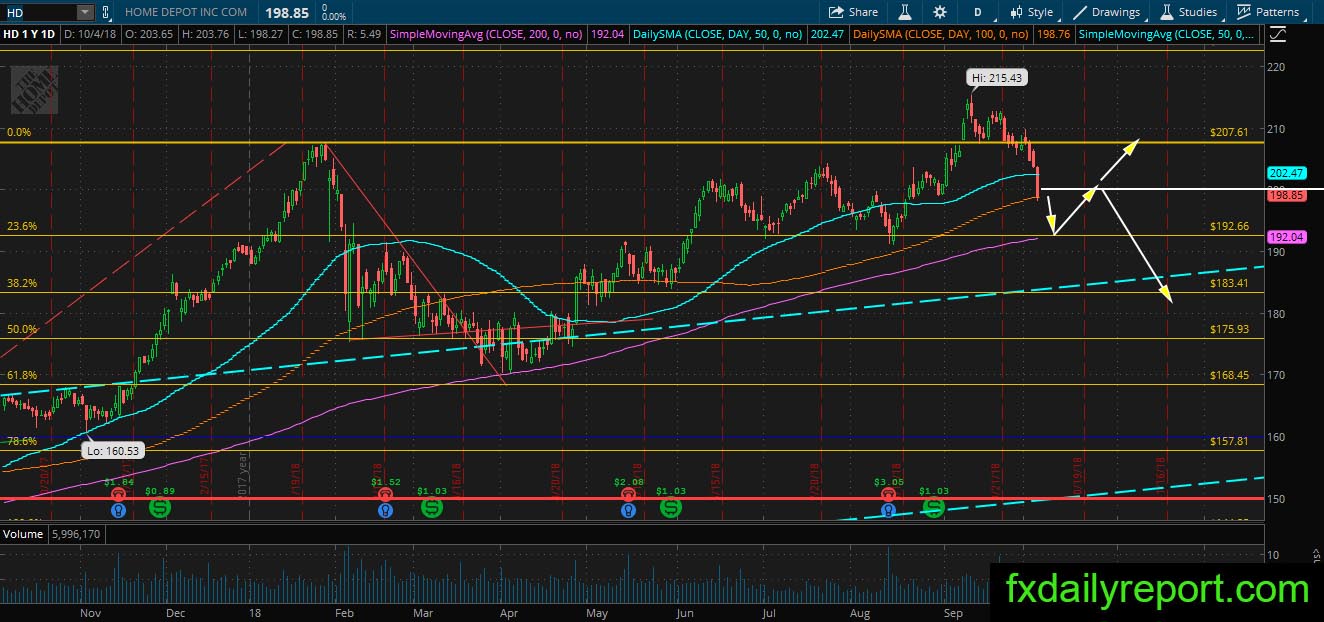
HD share prices losing altitude and accelerating downside. It closed below $200.00 and the daily SMA 100 signaling further selling toward SMA 200. It is not the best location to place a short position as a reversal could happen anytime. However, traders could look for the short position if we have bounced from SMA 200 and the bearish pattern formed when $200.00 tested.
Weight Watchers (WTW)
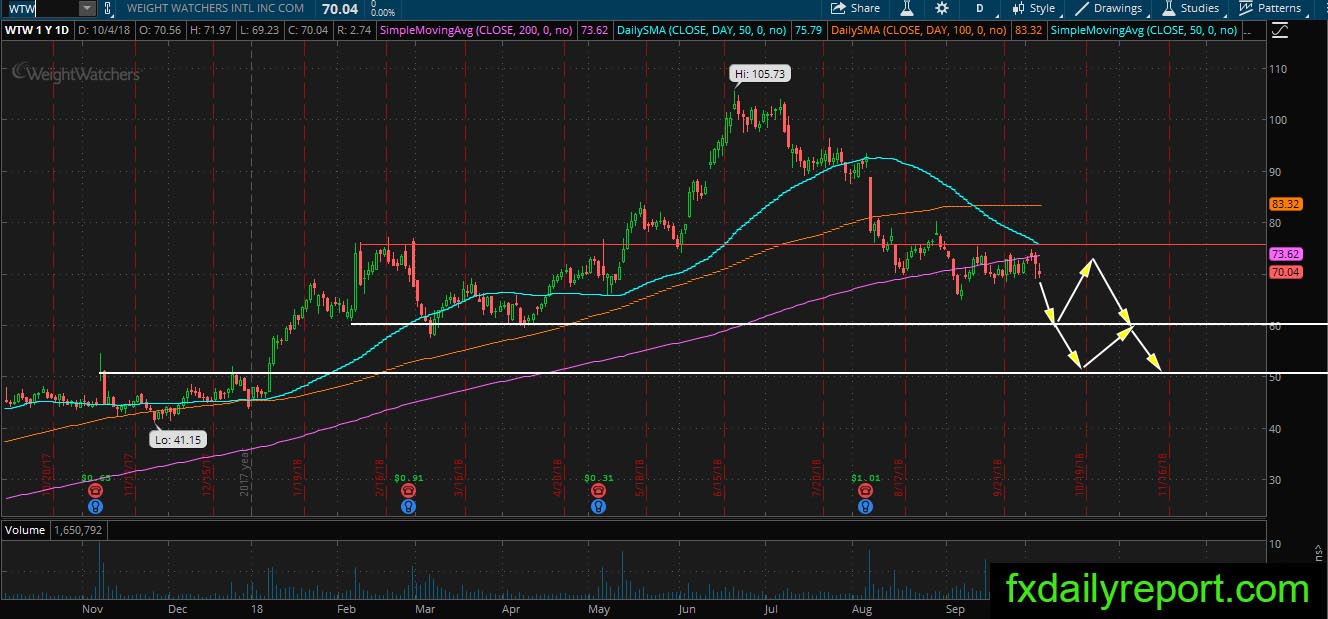
Bounce from daily SMA 200 is what traders and investors hope to happen in WTW. However, WTW showing hard-time near the averages and keep trading near it since September breakout. Under the current situation, the longer the share prices traded near SMA 200, the weaker it is. Shorting at current level with a stop above SMA 200 or $75.00 is recommended.