
Lower growth rate dampen investors mood
IMF lowered its global growth forecast as trade disruption intensifying. Growth rate revised from 3.9% to 3.7% this year. Citing U.S and China is the major focus in current trade wars. IMF maintain the growth rate for U.S and China at 2.9% and 6.6% respectively in 2018. However, both country will experience slow down in 2019 with the growth rate of 2.5% and 6.2%.
U.S stock market sets to open lower on lower growth forecast. DJIA futures turn lower 121 points currently. Will we see a continuation lower today?
Asian & European Stock market

Asian stock market continues its slide today. Nikkei down 314.33 points (-1.32%) to 23,469.39, China stock market up 4.51 points (+0.17%) to 2,721.02, and Australia ASX 200 down 59.20 points (-0.97%) to 6,041.10. European stock market could not weather Italy issue yet. DAX Germany down 0.56%, UK FTSE down 0.34%, Euro STOXX600 down 0.41%.
Technical Analysis
Dow Jones Industrial Average (INDU)
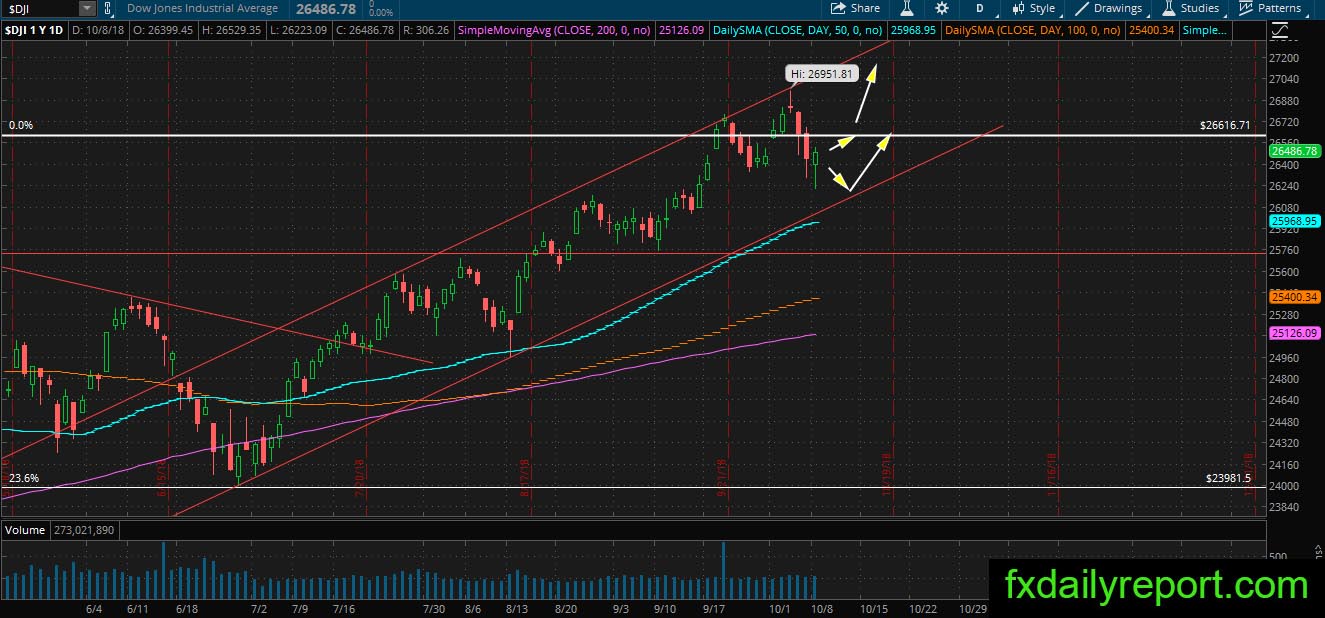
The index logged gain in the previous day after traded below its opening level most of the session. Although it is a bullish reversal pattern, the bull might not able to push the index higher today as negative sentiment clouded the market. We think the bear still in control and will push DJIA down to the bottom of its bullish channel.
Activision Blizzard (ATVI)
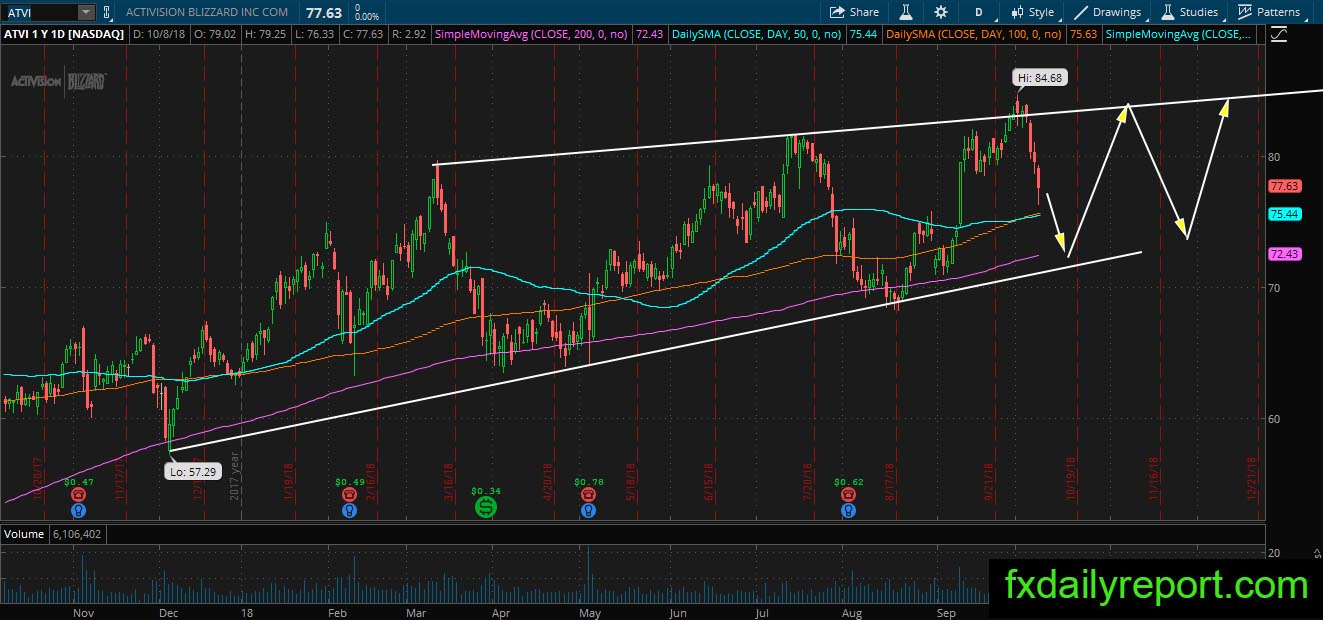
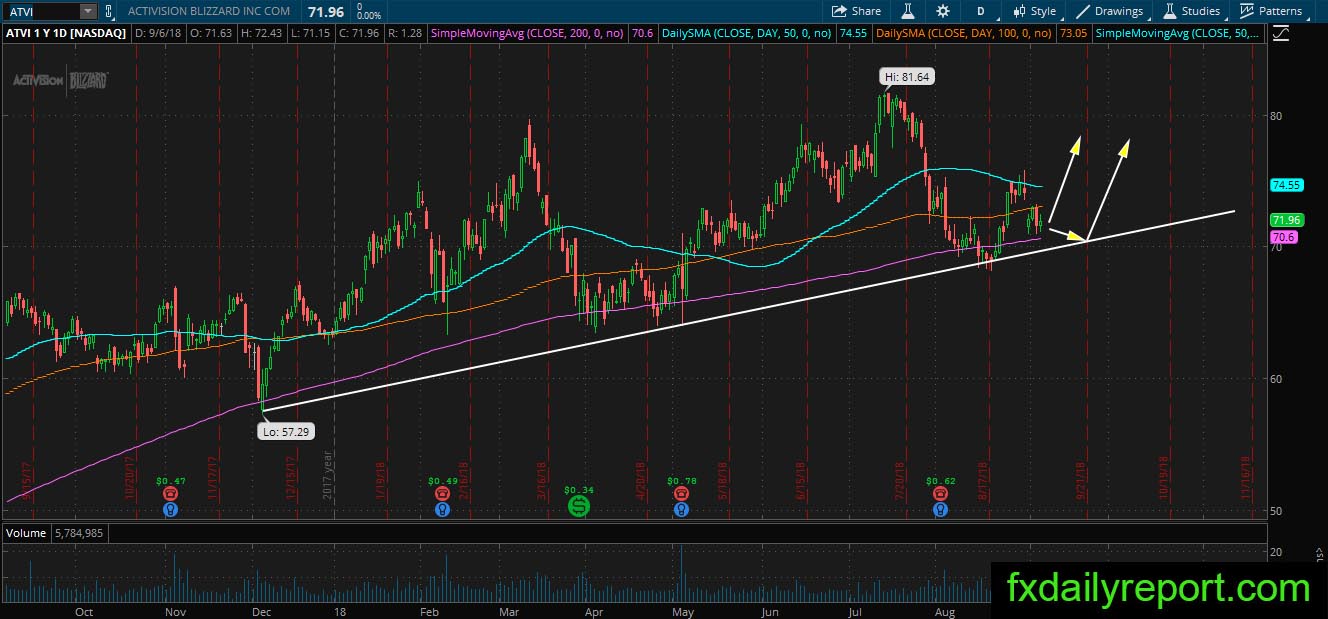
The bounce from bottom trendline brought ATVI up and print fresh high. Currently, the share prices retreat and almost reach the daily SMA 50. Traders could repeat the previous strategy, buying near SMA 200 or the trendline and ride ATVI to the top trendline with a tight stop below the support levels.
Shopify Inc (SHOP)

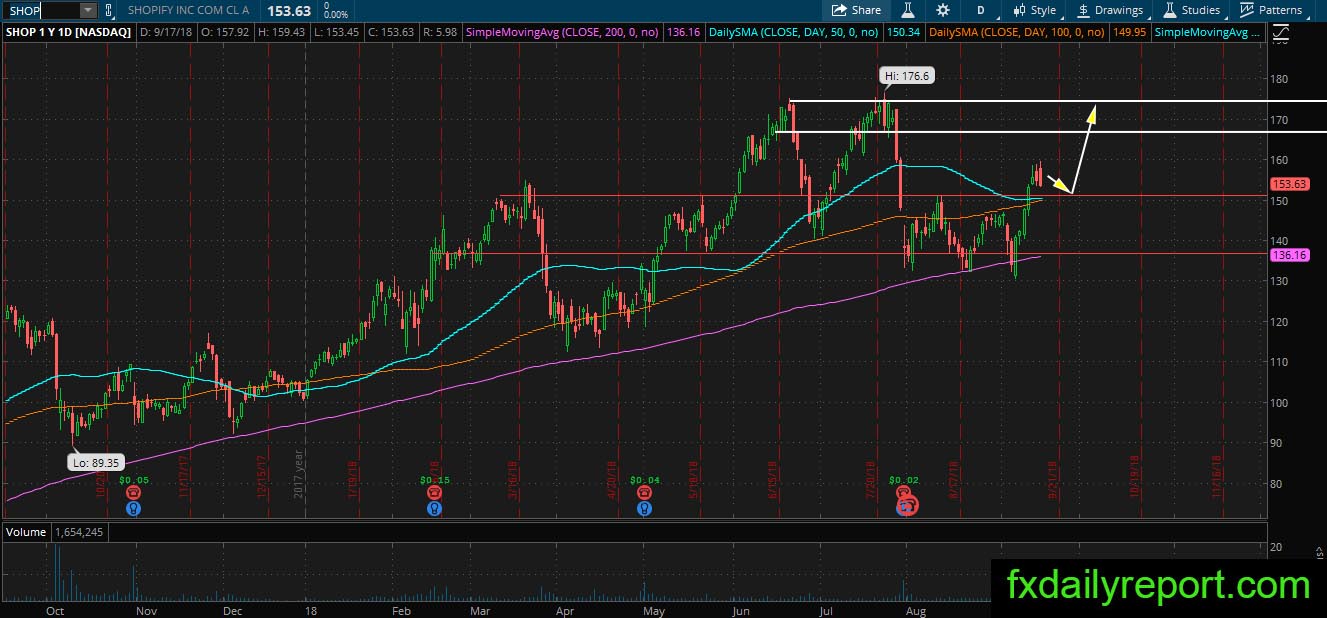
In the previous analysis, we project SHOP will hit the horizontal resistance on its daily chart before deciding the next direction. The share prices rejected from the horizontal resistance and traded near its SMA 200 now. Because of the strong bearish momentum, we might see further selling and retest on the SMA 200. When the retest happens, traders could place a short position.
On the other hand, if SHOP could produce a bullish pattern near SMA 200 then we will switch to the bullish side.