
Markets Stabilize as Oil Pullback Eases Geopolitical Concerns
Global markets showed signs of stabilization after recent volatility driven by the Iran conflict and the surge in oil prices. Crude oil, which recently spiked sharply amid fears of supply disruption, has pulled back from its highs, helping improve overall market sentiment. The easing of oil prices came as traders reacted to growing expectations that tensions around the Iran conflict could move toward resolution, reducing concerns about prolonged disruptions to global energy supply.
U.S. equities also recovered during the previous trading session. The Dow Jones Industrial Average closed at 47,740.80, up 239.25 points (+0.50%), while the S&P 500 finished at 6,795.99, gaining 55.97 points (+0.83%). The Nasdaq Composite led the gains, closing at 22,695.95, rising 308.27 points (+1.38%).

Despite the rebound, traders remain cautious as markets continue to monitor geopolitical developments and their potential impact on global energy supply and risk sentiment.
Dow Jones Industrial Average (INDU)
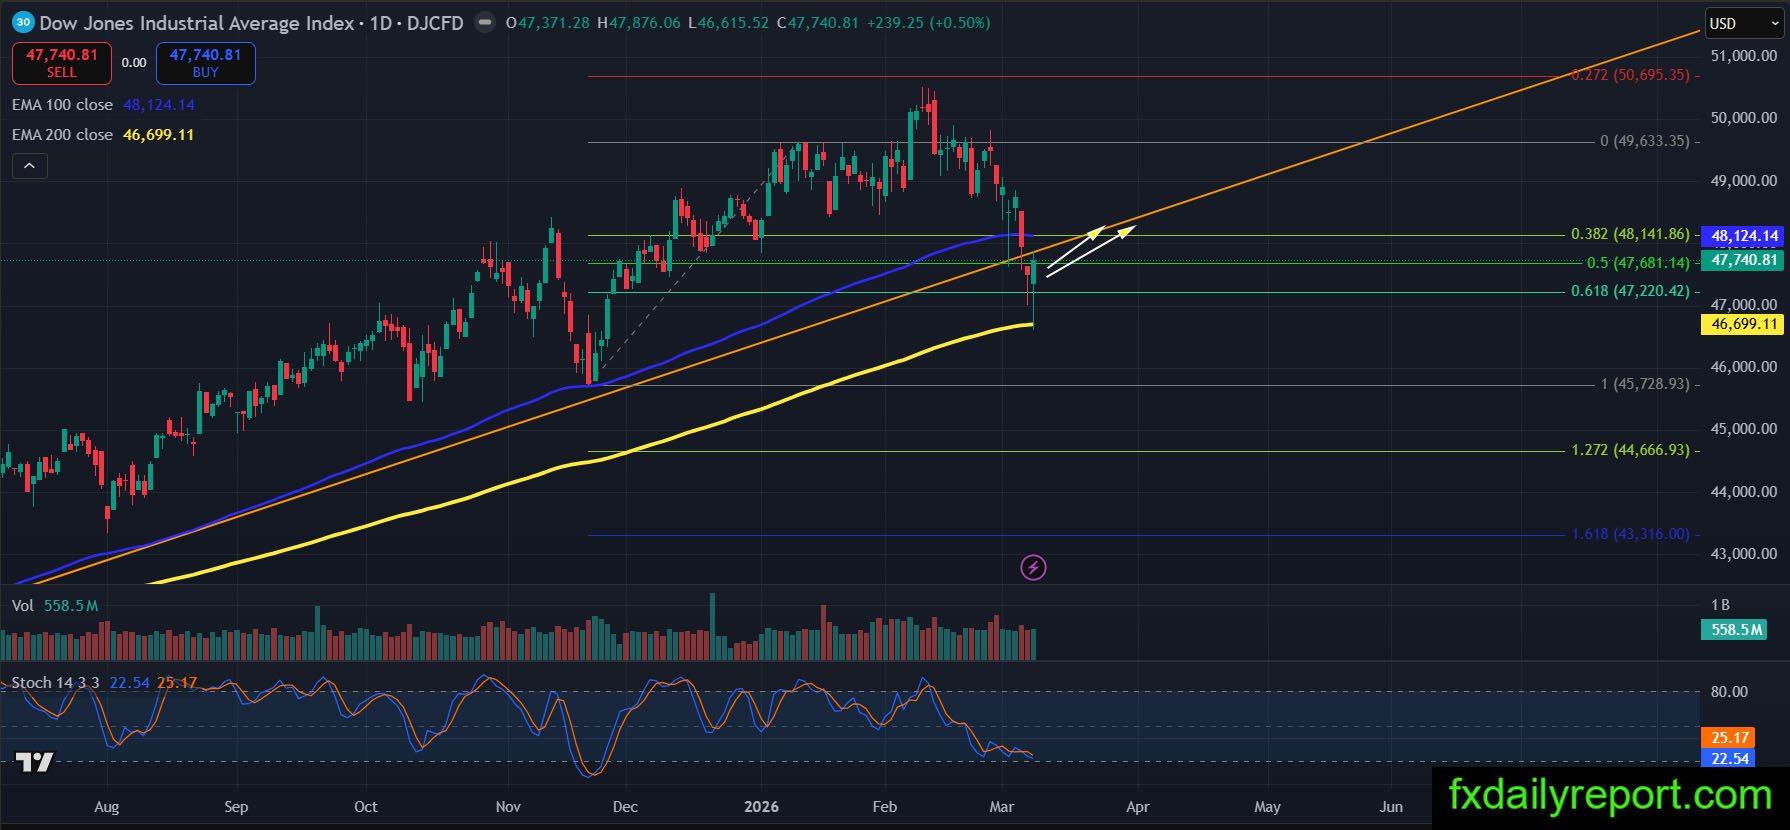
The Dow Jones Industrial Average extended its bearish movement earlier in the session, pushing lower and printing a new lower low. However, the decline found strong support near the EMA 200, where buyers stepped in aggressively. The index eventually reversed higher and closed the day with a bullish engulfing pattern, signaling a potential short-term recovery after the recent selloff.
Despite the bullish signal, traders should remain cautious because the index has already broken its previous swing structure by forming a lower low, which may indicate that the broader trend is starting to weaken. If the recovery continues, the index could attempt to move back toward the 48,000 resistance area near the EMA 100. Failure to maintain the rebound could see the market retesting the EMA 200 support zone again.
Enphase Energy Inc. (ENPH)
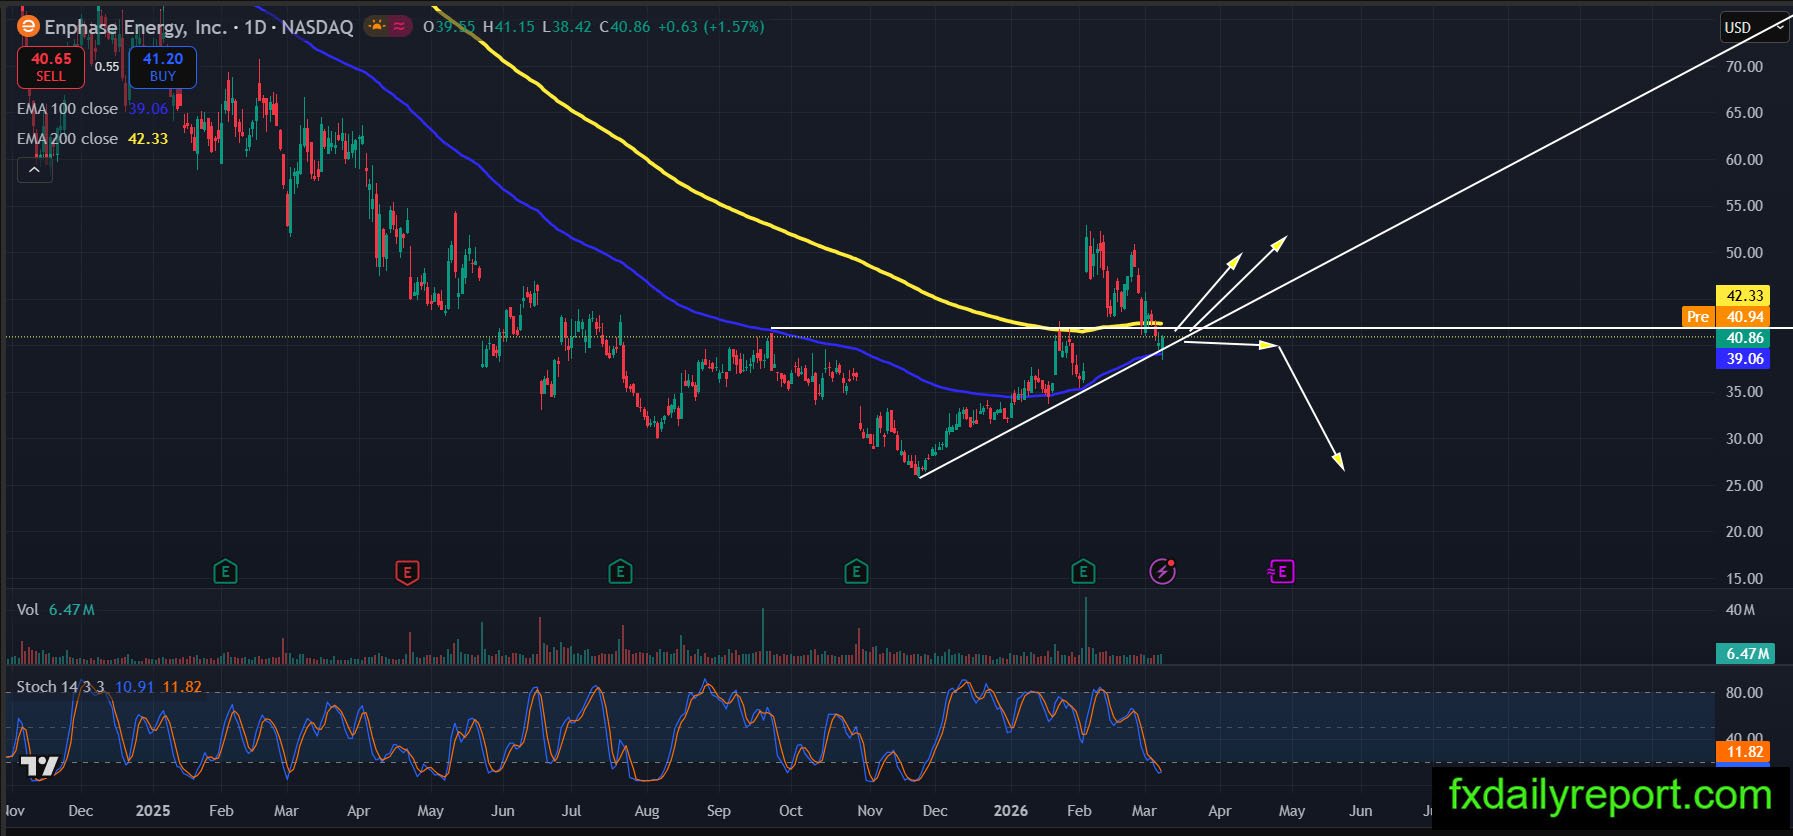
ENPH recently flipped above the EMA 200, which is often considered an important signal of a potential trend shift from bearish to bullish. After the breakout above the long-term average, the stock is now undergoing a corrective pullback, likely as part of a normal retracement following the initial breakout. This corrective phase could offer traders an opportunity to look for long positions near the current price area.
For risk management, traders may consider placing a stop loss below the previous higher low at $35.45, as a break below that level would invalidate the bullish structure. If the bullish momentum resumes, the stock could attempt to move toward the $50 area and higher resistance levels.