
Markets Pause as Investors Await Key Economic Signals
Global markets showed mixed performance during the previous trading session as investors remained cautious while waiting for new economic catalysts. After the recent recovery driven by easing geopolitical concerns and the pullback in crude oil prices, market momentum slowed as traders reassessed the broader outlook. The muted price action reflects a cautious market environment as investors continue monitoring geopolitical developments and upcoming economic data that could influence the next major market move.
U.S. equities ended the session with limited movement. The Dow Jones Industrial Average closed at 47,706.51, down 34.29 points (-0.07%), while the S&P 500 finished at 6,781.48, declining 14.51 points (-0.21%). The Nasdaq Composite ended the session nearly unchanged at 22,697.10, up 1.16 points (+0.01%).
Dow Jones Industrial Average (INDU)

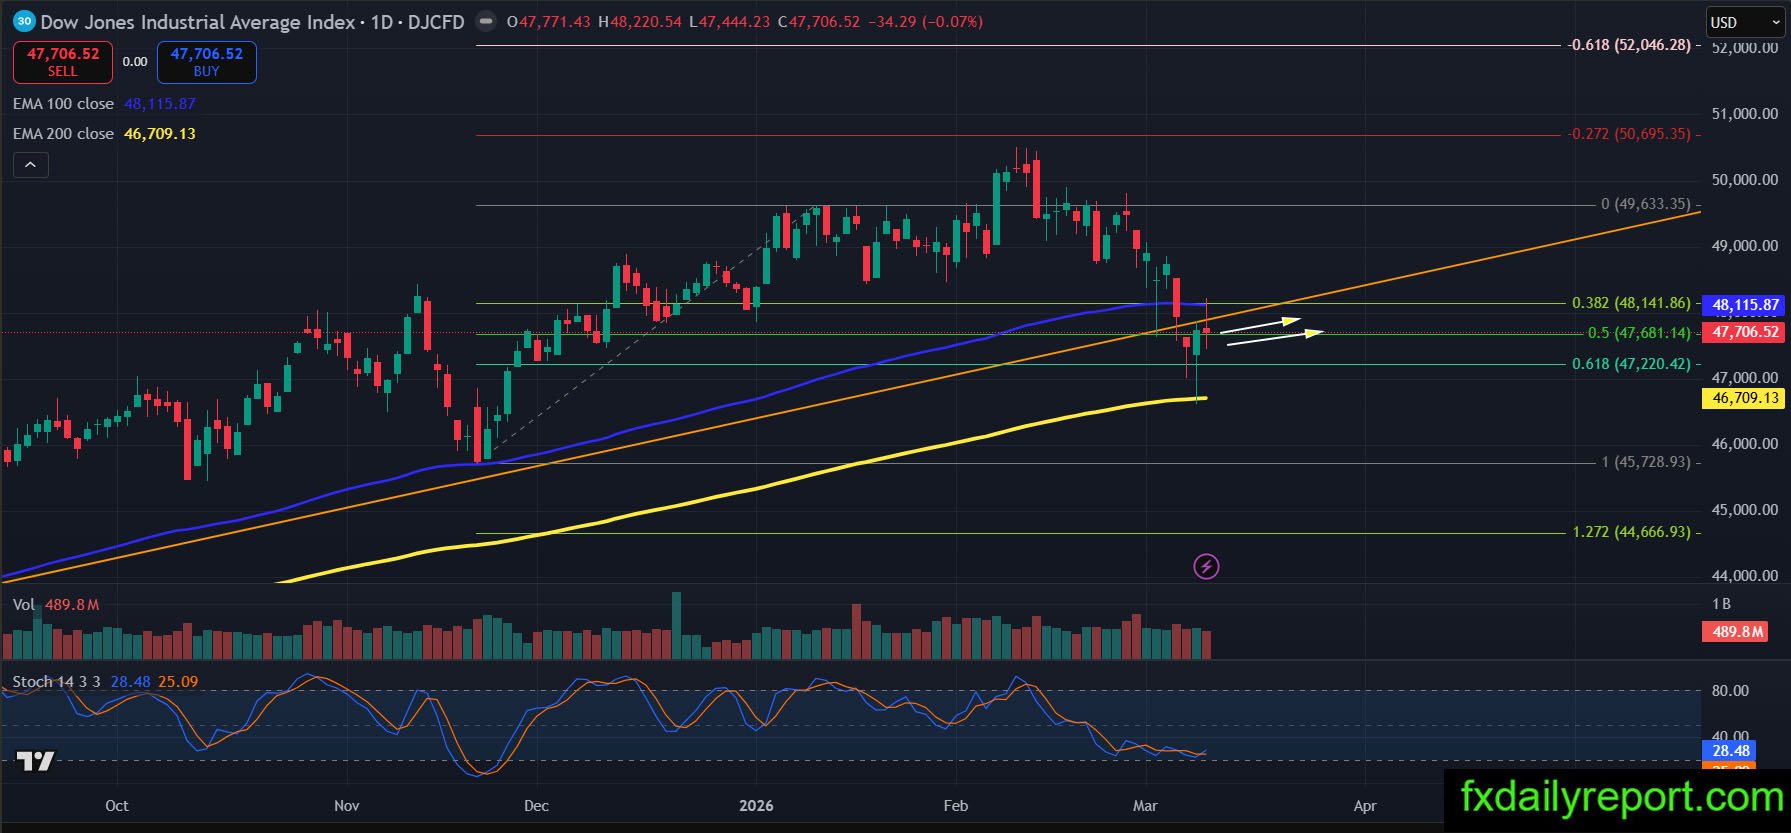
The Dow Jones Industrial Average attempted to recover during the session but faced rejection near the daily EMA 100 and eventually formed a bearish pin bar on the daily chart. This rejection indicates that sellers remain active around the resistance area. The rejection also coincides with the nearby trend line resistance, reinforcing the area as a key technical barrier for the index.
Despite the bearish signal, the broader structure has not confirmed a clear directional move yet. The index is currently trading between the daily EMA 100 and EMA 200, which could keep the market inside a consolidation range while traders wait for stronger confirmation of the next trend. If bearish pressure increases, the index could attempt another move toward the EMA 200 support. On the other hand, a breakout above the EMA 100 and the trend line resistance could allow the index to regain bullish momentum.
Canadian Solar Inc. (CSIQ)
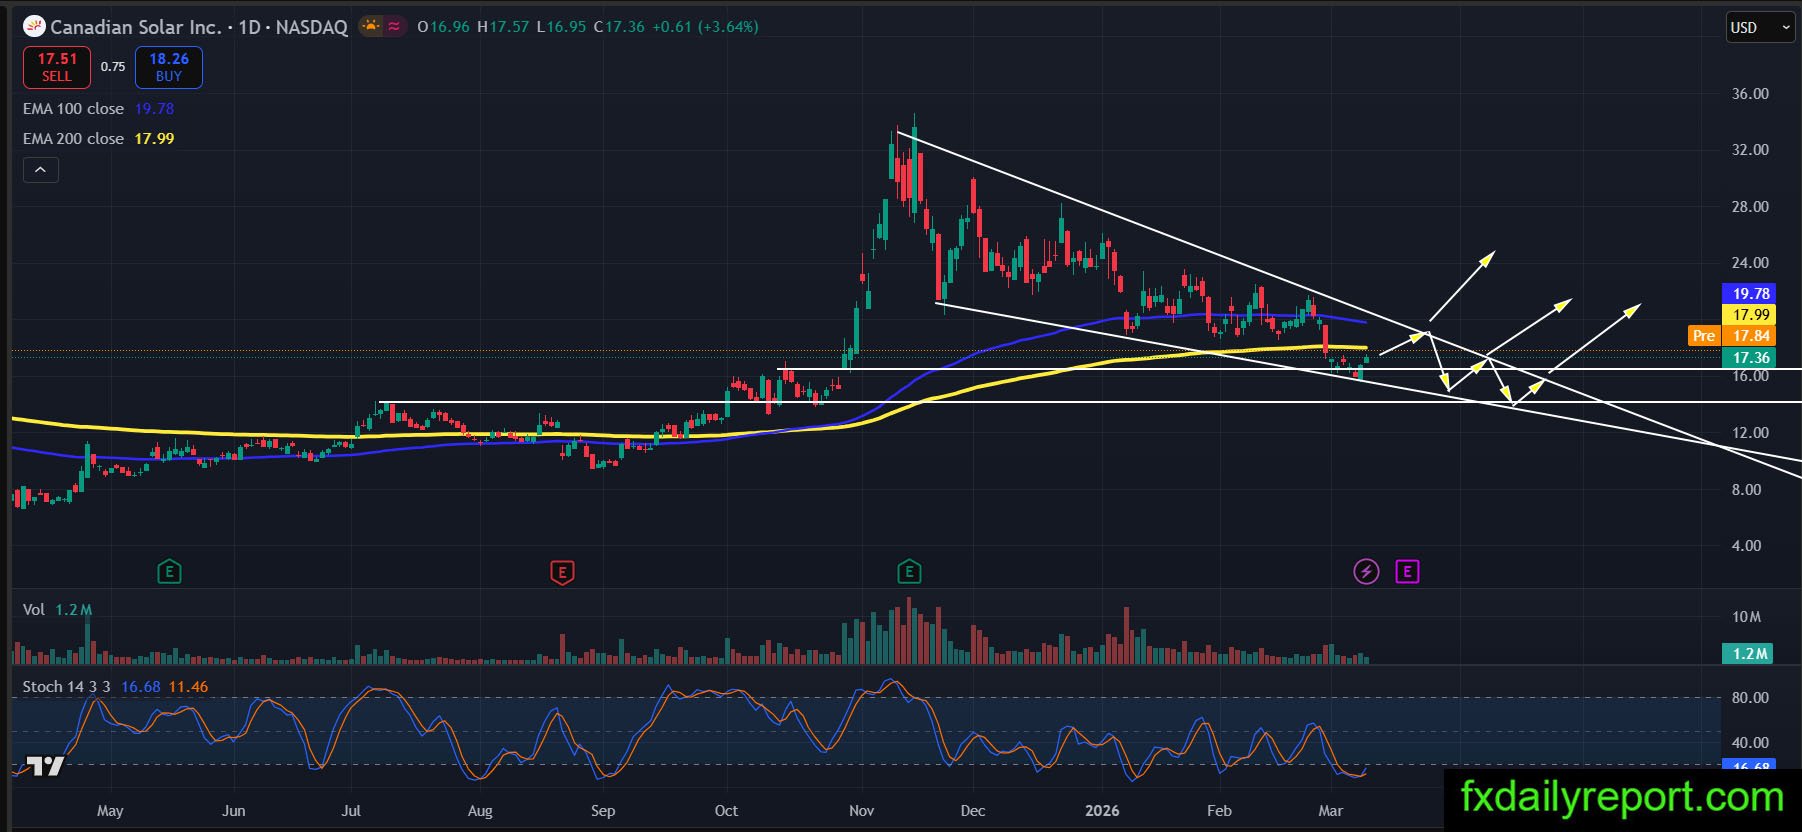
Canadian Solar appears to be forming a large flag pattern after the strong rally earlier in the trend. The recent price action suggests that the stock is currently consolidating while the market evaluates the next potential directional move. At the moment, the stock is trading below the daily EMA 200 and remains within the descending flag structure. The $15.00 level appears to be an important support area where buyers may attempt to defend the price.
A breakout above the descending trend line would provide confirmation that bullish momentum is returning and could open the path for a stronger bullish continuation. Until that breakout occurs, the stock may continue consolidating within the current structure. From a positioning perspective, accumulating long positions between the $14.00 area and the EMA 200 could be considered while monitoring for confirmation of a breakout above the trend line. Below $13.00 is the place to consider exiting positions.