
Positive cues to boost the market
Recent news about tax relief boosted the market, however, the boost outweighed by Apple warning that the tariff on China goods will affect the company wide-line of products. On Monday, there is good news come from China-North Korea. White House confirmed the warm request by North Korea for the second meeting between President Trump and North Korea leader Kim Jong Un.
This week main topic is whether the U.S will impose an additional $247 billion tariffs on China imported goods. Another tariff surely will invite retaliation and heightened the tension between U.S-China. Aside from the economy, there is a joint “war game” between Russia and China. This is the biggest war game since the cold war.
Asian & European Stock market

Asian stock market building positive sentiment today. Nikkei up 291.60 points (+1.30%) to 22,664.69, Shang Hai Composite down 6.30 points (-0.24%) to 2,663.18 and Australia ASX 200 up 38.00 points (+0.62%) to 6,179.70. European stock market set to open the day on the higher ground.
Technical Analysis
Dow Jones Industrial Average (INDU)
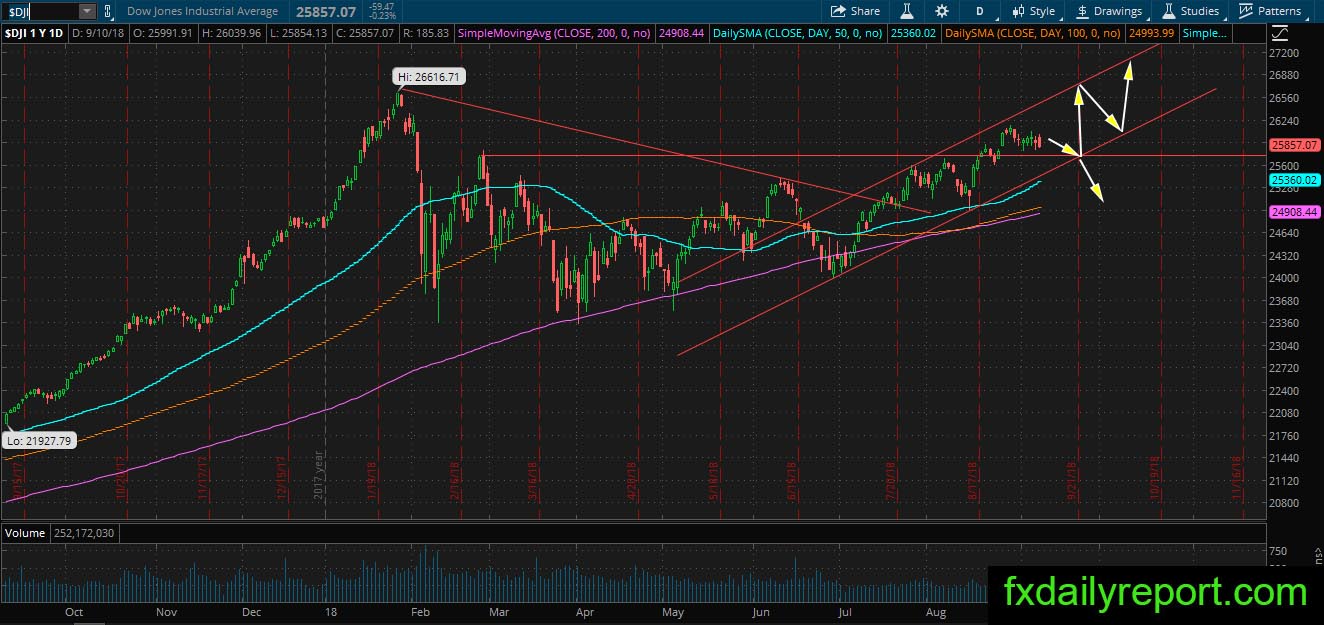
Dow Jones Industrial Averages fell in the previous trading day and looking to test the red horizontal support. It is possible for the index to test the support level. However, the days seems bullish in Asian trading session and European set to open the day at positive. If the bullish sentiment continues into U.S trading session then we might see DJIA start moving up and ignore the support test.
Deere & Co (DE)
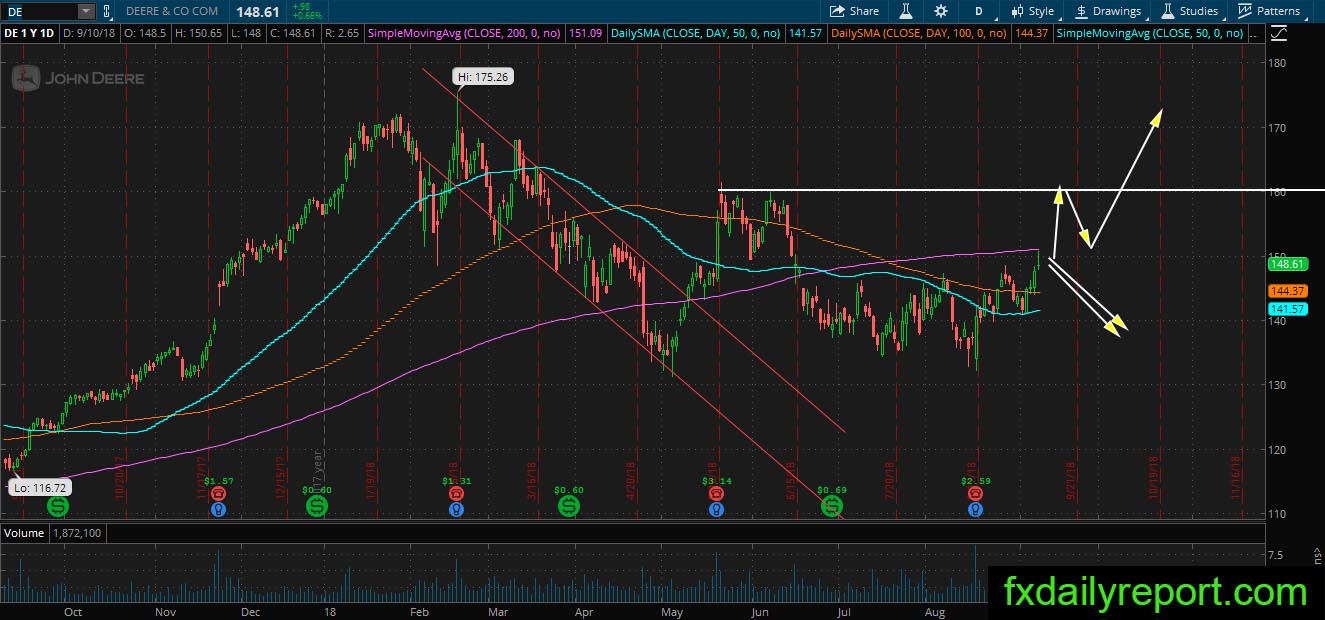
DE recent upward move tipped the daily SMA 200 and printed a bearish pin bar. It could be a sign of bearish reversal, but it could also mean the supply has been cleared. The bearish pattern needs more confirmation by a strong bearish close below it. If the bullish movement continues then traders could expect sharp jump above the averages followed by a retest.
McDonald Corp (MCD)
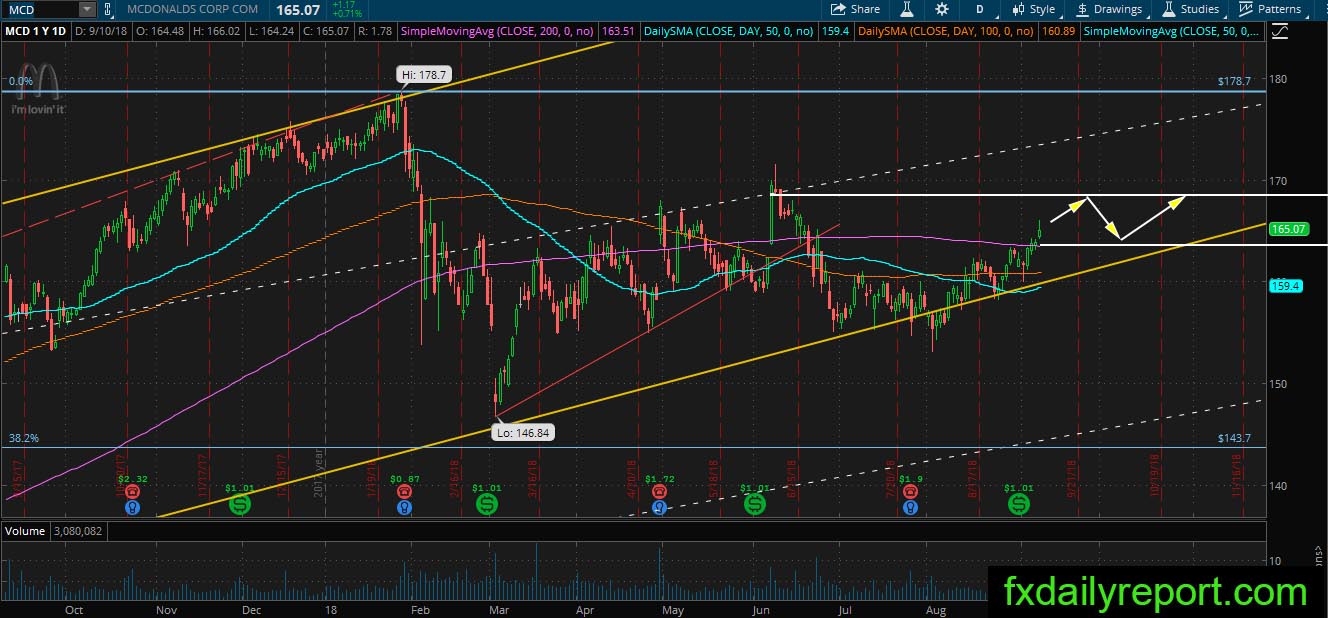
MCD share prices are worth to watch after the bull manages to make a close above the daily SMA 200. If the share prices move as expected then it will test the level around $168 – $170 before retracing to the daily SMA 200 for a retest. It is also possible for SMA 200 retest and bounce before the upward movement continues. Traders could look for a long position with a tight stop below the averages.
Other Watchlists
TXN – the share prices currently testing the daily SMA 200. It never fell below the averages before which is a good sign to look for a long position.