
Trade war tension eased, stock market climb
U.S stock market futures pointed upward in Asian and European session as trade war tension eased. Traders and investors return their focus to the economic data release. On Tuesday, China mentioned the intention to impose a tariff on up to $60 billion American products which will go into effect next week.
There is no major news release and no U.S federal reserve members scheduled for speech. Darden Restaurants (NYSE: DRI), Micron Technology (NASDAQ: MU) and Thor Industries (NYSE: THO) scheduled to report earnings today.
Asian & European Stock market

Asian stock market takes cautious approach today. Nikkei up 2.41 points (+0.01%) to 23,674.93, Shang Hai Composite down 1.60 points (-0.06%) to 2,729.25 and Australia ASX 200 down 20.50 points (-0.33%) to 6,169.50. European stock market confidently higher. DAX Germany up 0.41%, UK FTSE up 0.24%, Euro STOXX600 up 0.45%.
Technical Analysis
Dow Jones Industrial Average (INDU)

DJIA continue upside uninterrupted and getting near to challenge all-time high. The movement of the index is expected to reach the top before making any correction. There is no change to the current analysis and traders could continue holding a long position in the equity market.
First Energy Corp (FE)
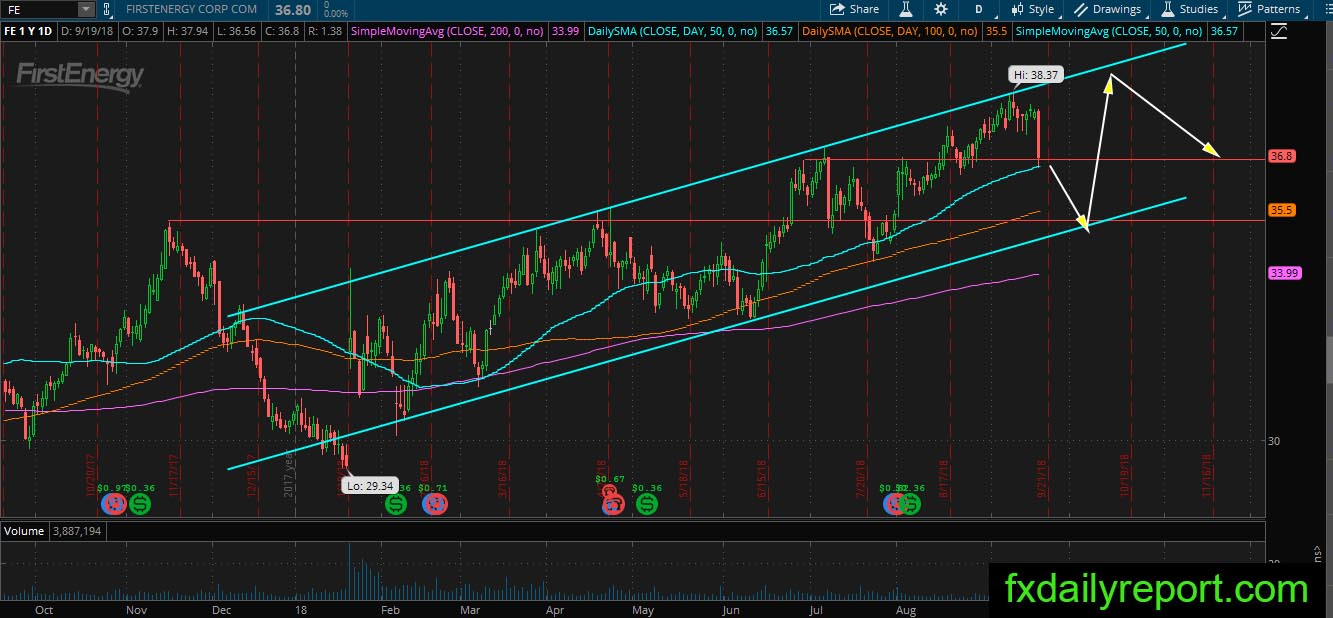
A deep one day slide happened in FE share prices and it brings the share prices down to its daily SMA 50. There is flip level near the averages but we think the bear still has power and could push FE down to SMA 100 or the second flip level. Traders could prepare for long position near the second flip level or the bottom of the blue channel.
Tiffany & Co (TIF)
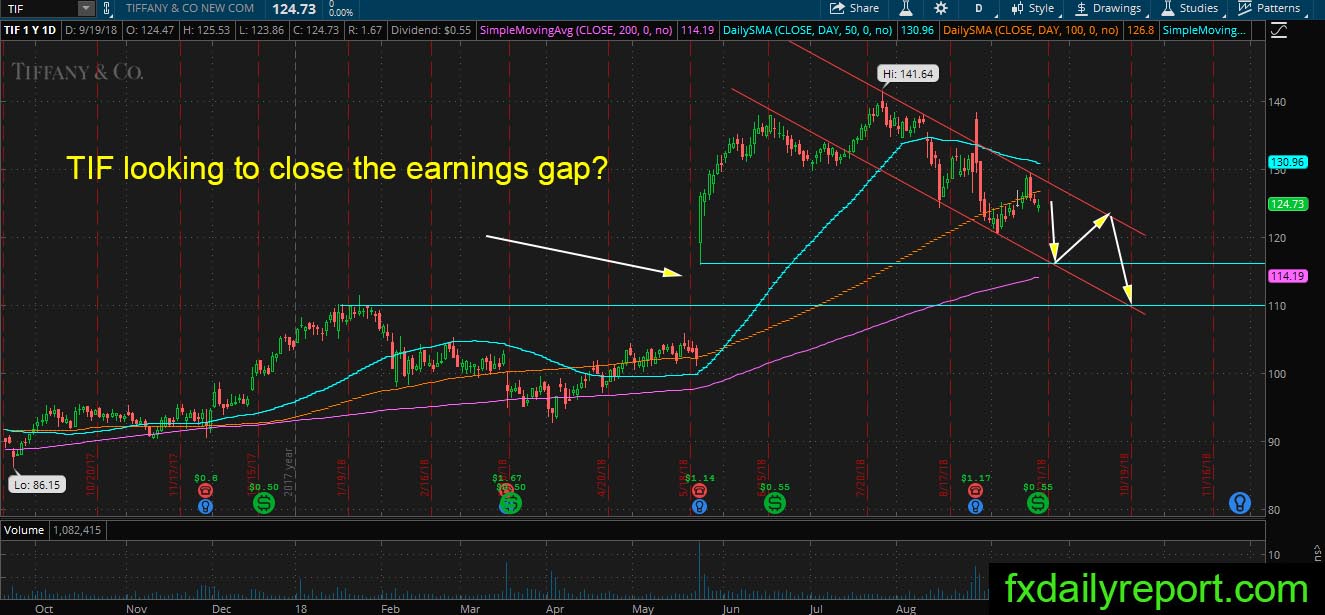
TIF gapped up after earnings and progressed higher to print all-time high at $141.64. However, the share prices losing steam and slowly moving down. Recently, it reached the daily SMA 100 and currently stick near the averages. Base on the bearish channel on the daily chart, TIF might have more room downside. The bottom of the channel, a level between $110.00 – $115.00 and the daily SMA 200 are resistances which traders will watch when the share prices moving down.