
Rebalancing before The Fed interest-rate
Global market shrugging trade issue and expectation of rate-hike by bringing equity market up. It seems short-seller cashing out before the major news from the central bank and looking for another chance to short higher. President Trump commented on U.S-Mexico deal, saying the deal will proceed even if it excludes Canada. Aside from the comment, Trump also reiterates the administration stance toward the United Nation on trade. The President said will not tolerate abuse anymore.
The market will watch U.S crude oil data today, forecast saw a deficit of 0.7 million barrels. OPEC become the firing target by President Trump as the president said OPEC “ripping off” the world on high oil price.
Asian & European Stock market

Asian stock market climb higher today. Nikkei up 93.53 points (+0.39%) to 24,033.79, Shang Hai Composite up 25.68 points (+0.92%) to 2,806.81, and Australia ASX 200 up 6.40 points (+0.10%) to 6,192.30. European stock market mixed. DAX Germany down 0.19%, UK FTSE up 0.08%, Euro STOXX600 up 0.02%.
Technical Analysis
Dow Jones Industrial Average (INDU)
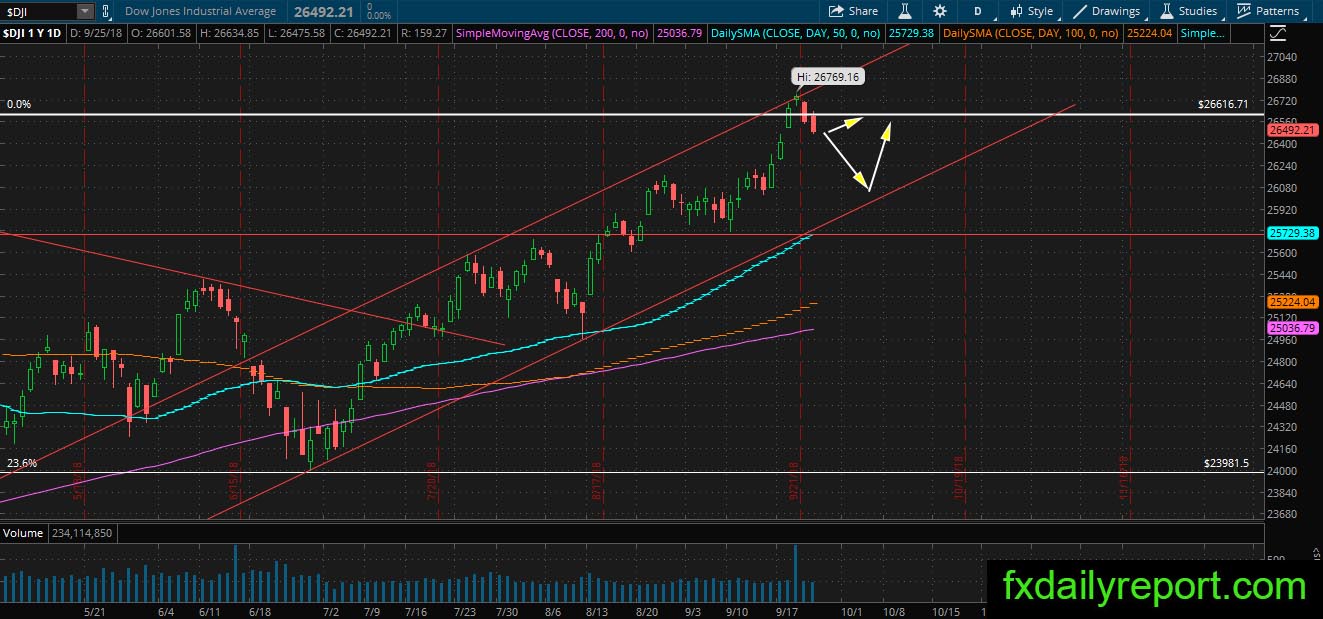
DJIA make a second day bearish close and distance itself from top of channel. The bearish close might be enough to confirm the index will start moving down to reach the bottom of the channel. However, there is news from The Fed today which could move the market the other way. Assuming there is no major change, we expect the index to continue its bearish movement.
Citigroup Inc (C)

C share prices will benefit from higher interest-rate and current share prices movement showing the market optimism on rate-hike. We have a level around $73.25 and daily SMA 200 as a buying area.
Mondelez International Inc (MDLZ)

MDLZ supported by the blue trendline and there is a cluster of supports below the level. We have red trendline, SMA 50 and SMA 200 as buying level. Traders could prepare for long position when the share prices hit supports and print bullish patterns.