
Major bearish correction in the U.S market?
Last week, the stock market weaken sharply as the technology sector undergo profit-taking. The tech stock has been on the bullish run since March bottom. Nasdaq composite nearly doubled from 6,631.42 low to 12,074.06 high. Traders could see the indices supported by the daily SMA 50.
If the profit-taking continues then the Nasdaq composite will trigger further weakness and target the 10,000 handles. It means traders and investors might switch from technology sector and move to other sectors left behind when the coronavirus strike.

Today, the U.S stock market is close on labor day holiday.
Asian & European Stock market
The Asian stock market mostly lower today. Japan stock market down 115.48 points (-0.50%) to 23,089.95, China stock market down 62.78 points (-1.87%) to 3,292.59 and Australia ASX 200 up 19.30 points (+0.33%) to 5,944.80. The European stock market trade on the bullish side. DAX Germany up 1.24%, FTSE UK up 1.31%, Euro STOXX 600 up 1.00%
Technical Analysis
Dow Jones Industrial Average (INDU)
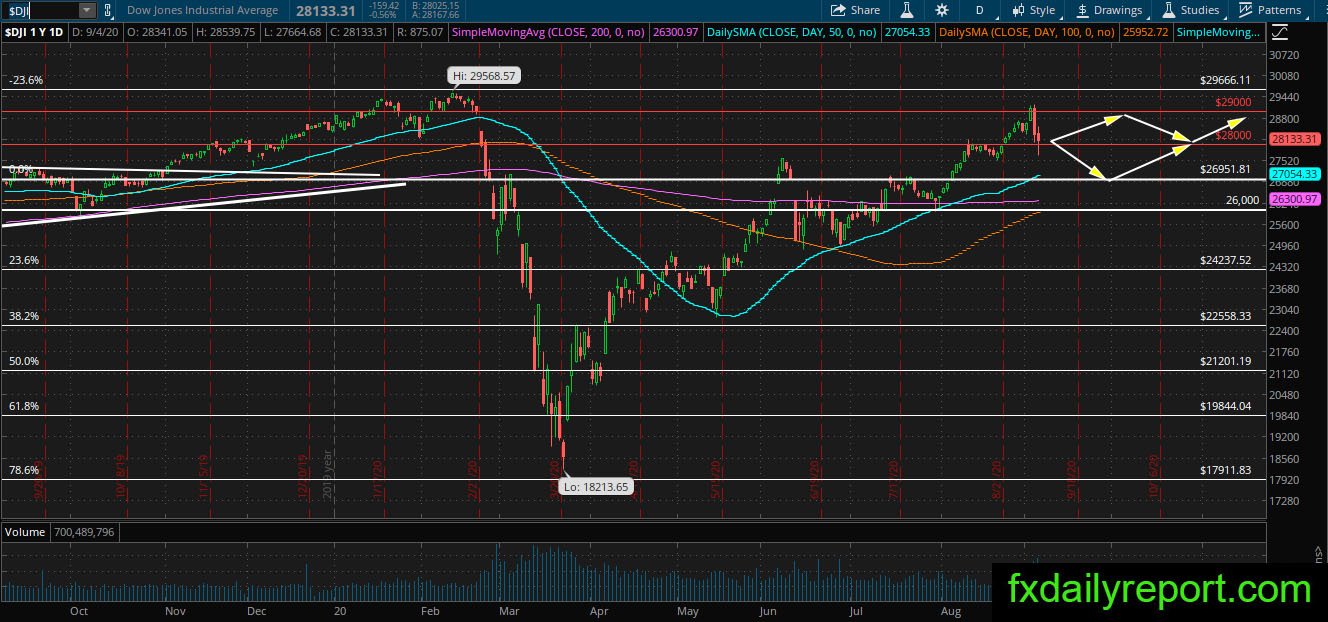
DJIA extended its bearish movement and close lower at the end of the previous week. The index closed near the 28,000 handles or managed to hold the positions inside 28,000 – 29,000 range. This week, the index might open near the current level as the DJIA futures traded flat near 0 levels.
No conclusion yet on the index next direction. As long as the index maintains the positions above 28,000, it could continue to target the all-time high and 30,000.
Spotify Technology (SPOT)
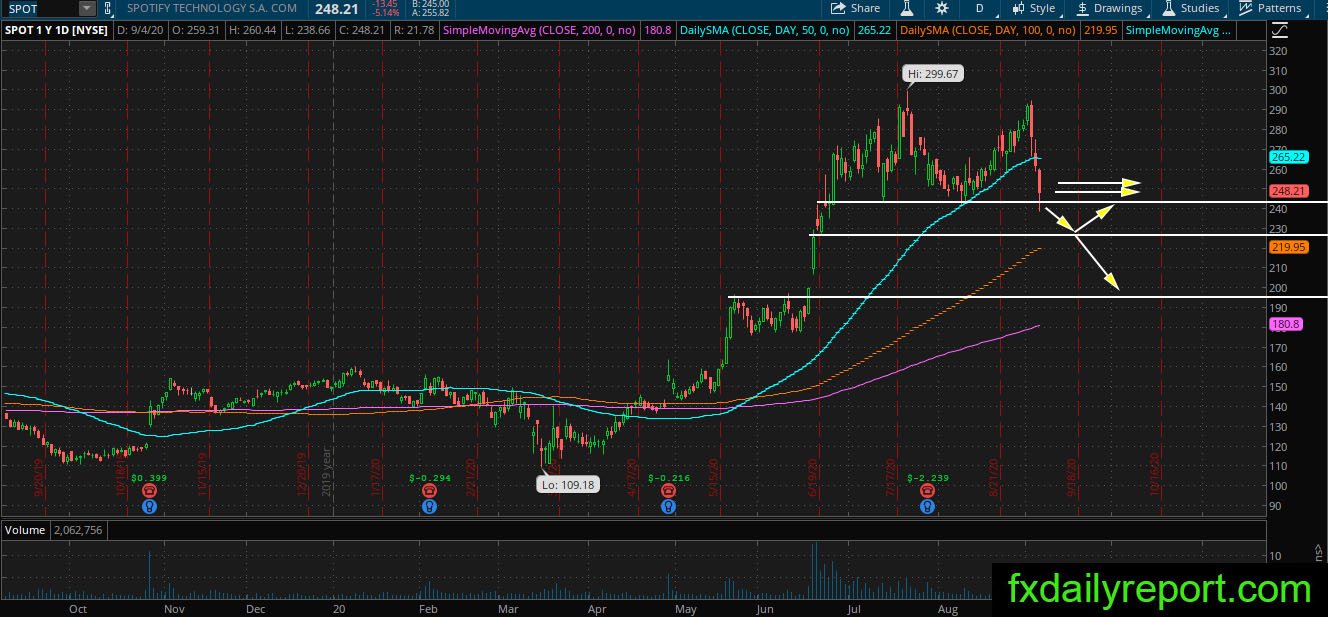
SPOT share prices made a double top pattern and start a bearish leg toward the support level around $240.00 – $245.00. It managed to hold out above the support level. However, the bearish pressure has strong momentum and we might see further downside this week.
If SPOT share prices continue lower then it might target the level around $230.00 and daily SMA 100. A deeper correction could bring share prices down to test $200.00.