
The USD/CAD currency pair on Wednesday spiked to complete a bullish breakout from a sideways channel formation. The currency pair has now advanced to trade at about 1.2889 after bottoming at about 1.2810 on Tuesday.
The pair seems to have found some resistance at the 100-hour moving average line in the 60-min chart. This prevented the currency pair from advancing into the overbought conditions of the 14-hour RSI.
USD/CAD Fundamentals Overview

From a fundamental perspective, the USD/CAD currency pair is trading at the back of a relatively busy period in both markets. On Wednesday, the US building permits for April outperformed the (MoM) expectation of 1.812 million with 1.819 million. On the other hand, housing starts for the period came short of the expected (MoM) change of 1.765 million with 1.724 million.
On Tuesday, the US retail sales control group beat the expected change of 0.5% with 1%. General retail sales also outshone 0.7% with 0.9% (MoM), while retail sales ex-autos beat 0.3% with 0.6%.
In Canada, The Bank of Canada’s core consumer price index for April beat the (YoY) expectation of 5.4% with 5.7%, while the (MoM) equivalent outperformed the expectation of 0.4% with 0.7%. The general CPI for the period exceeded both the (MoM) and (YoY) expectations of 0.5% and 6.7%, respectively with 0.6% and 6.8%.
USD/CAD Technical Analysis (the 60-min Chart)
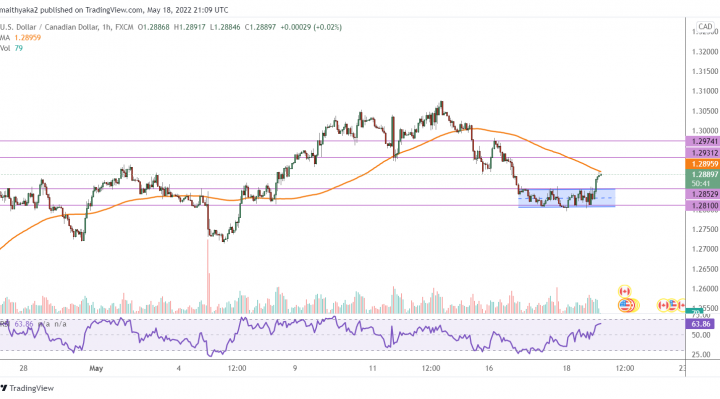
Technically, the USD/CAD currency pair seems to have recently spiked to complete an upward breakout from a sideways channel formation in the 60-min chart. This indicates a significant rise in short-term bullish bias in the market segment.
Therefore, the bulls will be looking to extend the current rebound towards 1.2931 or higher to 1.2974. On the other hand, the bears could look to pounce on potential pullbacks at about 1.2852, or lower at 1.2810.
USD/CAD Technical Analysis (the Daily Chart)
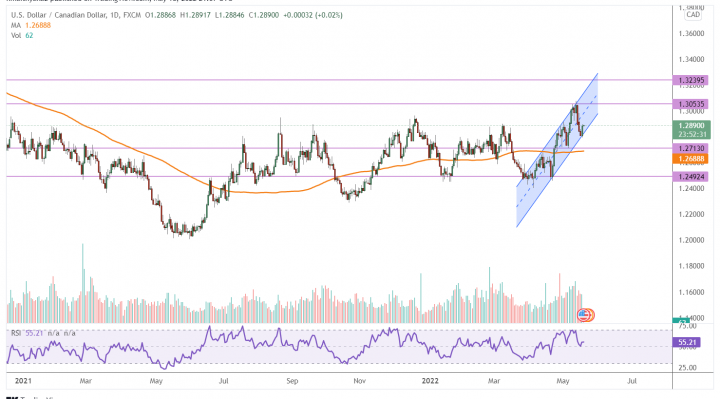
In the daily chart, the USD/CAD currency pair seems to be trading within an ascending channel formation. This indicates a significant long-term bullish bias in the market sentiment.
Therefore, the bulls could look to ride the current run by targeting profits at about 1.3053, or higher at 1.3239. On the other hand, the bears will look to pounce on potential reversals at about 1.2713 or lower at 1.2492.